• Photonics Research
  • Vol. 11, Issue 7, 1175 (2023)
Kai-Chi Chang1、†,*, Xiang Cheng1、2、†, Murat Can Sarihan1, and Chee Wei Wong1、3
Author Affiliations
  • 1Fang Lu Mesoscopic Optics and Quantum Electronics Laboratory, Department of Electrical and Computer Engineering, University of California, Los Angeles, California 90095, USA
  • 2e-mail: chengxiang@ucla.edu
  • 3e-mail: cheewei.wong@ucla.edu
  • show less
    DOI: 10.1364/PRJ.483570 Cite this Article Set citation alerts
    Kai-Chi Chang, Xiang Cheng, Murat Can Sarihan, Chee Wei Wong. Towards optimum Franson interference recurrence in mode-locked singly-filtered biphoton frequency combs[J]. Photonics Research, 2023, 11(7): 1175 Copy Citation Text show less
    Measured single-photon cross correlations and time-energy entanglement using a 5.03 GHz FSR singly filtered BFC. (a) Schematic of experimental configuration. FRM, Faraday mirror; C.C., coincidence counts; SNSPD, superconducting nanowire single-photon detector. Inset: the signature of observed Franson interferences, with the single-sided correlation function revealed (see the highlighted region in the blue dashed lines). (b) Measured JTI of a 5.03 GHz FSR singly filtered BFC. The photon coincidence data are recorded between two detectors, and we sift the coincidence data into frames of duration d×Tbin, composed of d time bins of duration Tbin. We choose Tbin to be 16 ps to enhance the resolution of temporal correlations. This d of 128 shows that there are ∼4 clean cross correlations from a* to d* in our 5.03 GHz singly filtered BFC. The red arrow indicates both the cross sections of measured JTI [also shown in the inset of (b)], and the direction of singly filtered temporal waveform. Inset: measured zoom-in second-order cross-correlation function between signal and idler photons. The periodic structure traces the cavity round-trip time of 198.9 ps. A cavity bandwidth of 457 MHz can be derived by the exponential decay of the envelope. Our result in the inset of (b) is consistent with our results in (b). (c) Example measured JSI of a 5.03 GHz FSR singly filtered BFC. For these measurements, we use a pair of tunable frequency filters to scan from the −9 to +9 frequency bins. (d) The observed quantum time-energy entanglement of a 5.03 GHz FSR singly filtered BFC source and witnessed Franson fringe with an accidental-subtracted visibility of 97.79% for central time bin.
    Fig. 1. Measured single-photon cross correlations and time-energy entanglement using a 5.03 GHz FSR singly filtered BFC. (a) Schematic of experimental configuration. FRM, Faraday mirror; C.C., coincidence counts; SNSPD, superconducting nanowire single-photon detector. Inset: the signature of observed Franson interferences, with the single-sided correlation function revealed (see the highlighted region in the blue dashed lines). (b) Measured JTI of a 5.03 GHz FSR singly filtered BFC. The photon coincidence data are recorded between two detectors, and we sift the coincidence data into frames of duration d×Tbin, composed of d time bins of duration Tbin. We choose Tbin to be 16 ps to enhance the resolution of temporal correlations. This d of 128 shows that there are 4 clean cross correlations from a* to d* in our 5.03 GHz singly filtered BFC. The red arrow indicates both the cross sections of measured JTI [also shown in the inset of (b)], and the direction of singly filtered temporal waveform. Inset: measured zoom-in second-order cross-correlation function between signal and idler photons. The periodic structure traces the cavity round-trip time of 198.9 ps. A cavity bandwidth of 457 MHz can be derived by the exponential decay of the envelope. Our result in the inset of (b) is consistent with our results in (b). (c) Example measured JSI of a 5.03 GHz FSR singly filtered BFC. For these measurements, we use a pair of tunable frequency filters to scan from the 9 to +9 frequency bins. (d) The observed quantum time-energy entanglement of a 5.03 GHz FSR singly filtered BFC source and witnessed Franson fringe with an accidental-subtracted visibility of 97.79% for central time bin.
    Experimentally observed discretized time-energy entanglement using 5.03 GHz and 15.15 GHz FSR singly filtered BFCs. (a)–(f) Franson recurrence interference fringes with six discrete time bins measured in a 15.15 GHz FSR singly filtered BFC. (g) Theoretical Franson revival visibilities for 15.15 GHz and 5.03 GHz FSR singly filtered BFCs with superimposed experimental observations. Further included in a* and b* are measured Franson recurrence time bins in a 5.03 GHz FSR singly filtered BFC. The experimentally measured (theoretical) visibilities for the six time bins (in red) for the 15.15 GHz FSR singly filtered BFC are 98.97% (100%), 74.32% (75.43%), 54.37% (56.89%), 40.56% (42.91%), 31.5% (32.37%), and 22.32% (24.41%), respectively. For the two time bins in a 5.03 GHz FSR singly filtered BFC, the experimentally measured (theoretical) visibilities are 97.79% (100%) and 72.23% (75.03%), respectively. The two bidirectional black horizontal arrows indicate the similarity of Franson revival visibilities between two cavities. All measurements are performed with a coincidence window of 2 ns and the reported visibilities are after subtracting accidental coincidences.
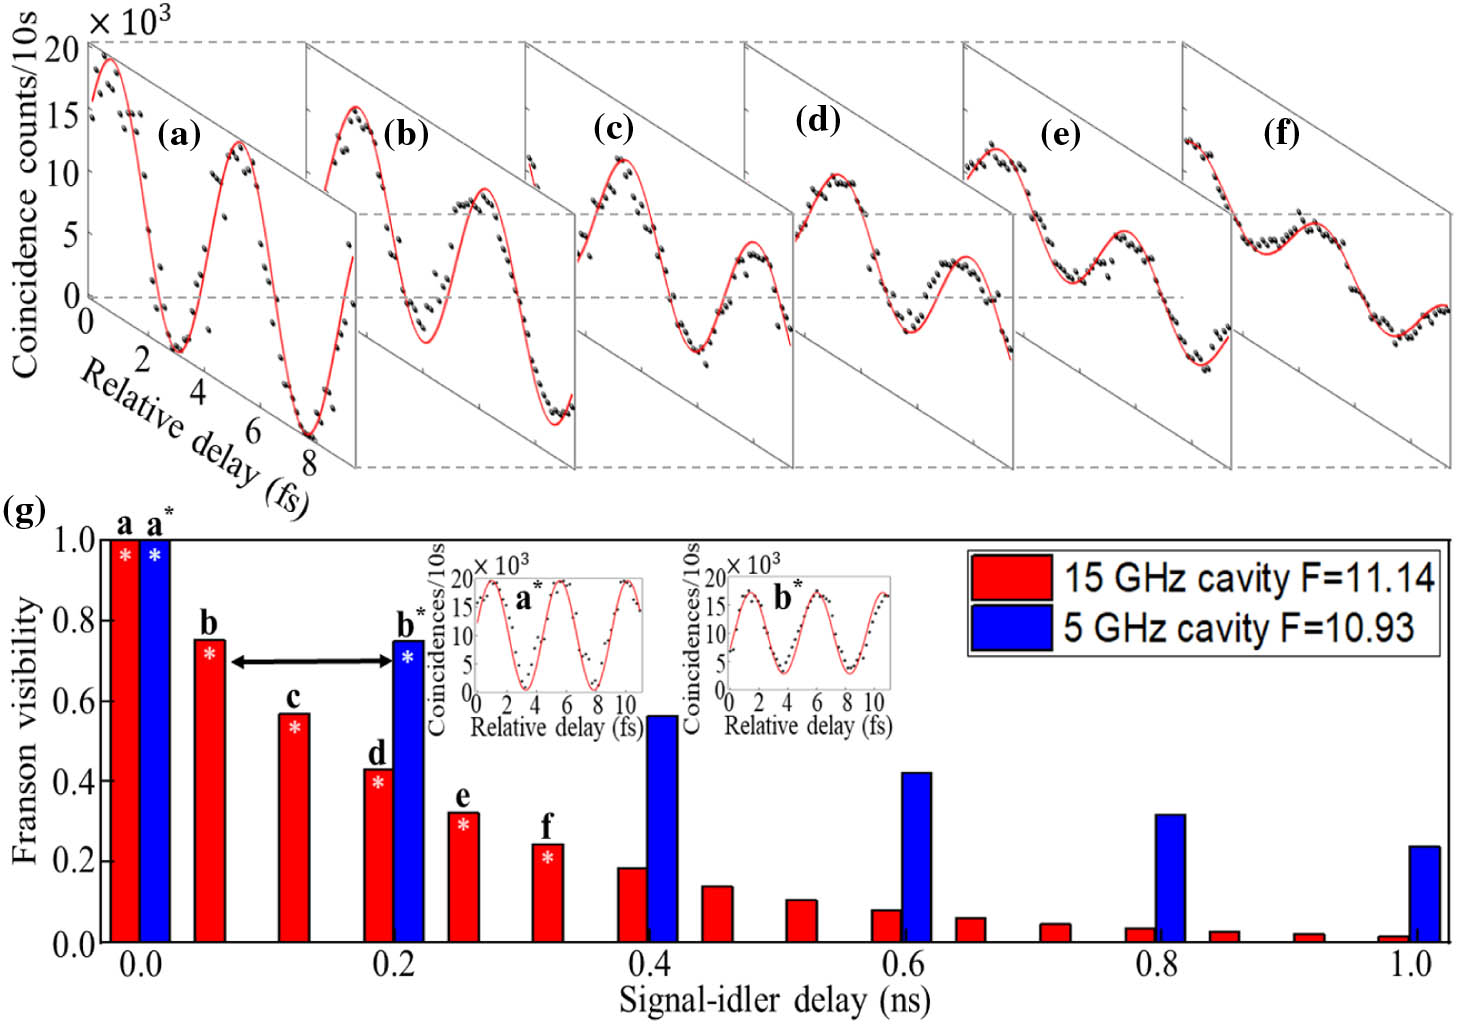
    Fig. 2. Experimentally observed discretized time-energy entanglement using 5.03 GHz and 15.15 GHz FSR singly filtered BFCs. (a)–(f) Franson recurrence interference fringes with six discrete time bins measured in a 15.15 GHz FSR singly filtered BFC. (g) Theoretical Franson revival visibilities for 15.15 GHz and 5.03 GHz FSR singly filtered BFCs with superimposed experimental observations. Further included in a* and b* are measured Franson recurrence time bins in a 5.03 GHz FSR singly filtered BFC. The experimentally measured (theoretical) visibilities for the six time bins (in red) for the 15.15 GHz FSR singly filtered BFC are 98.97% (100%), 74.32% (75.43%), 54.37% (56.89%), 40.56% (42.91%), 31.5% (32.37%), and 22.32% (24.41%), respectively. For the two time bins in a 5.03 GHz FSR singly filtered BFC, the experimentally measured (theoretical) visibilities are 97.79% (100%) and 72.23% (75.03%), respectively. The two bidirectional black horizontal arrows indicate the similarity of Franson revival visibilities between two cavities. All measurements are performed with a coincidence window of 2 ns and the reported visibilities are after subtracting accidental coincidences.
    Modeled and experimental mode-locking oscillations, Franson revival visibilities for 5.03 GHz, 15.15 GHz, and 15.11 GHz FSR singly filtered BFCs. (a) and (b) Theoretical signal-idler cross-correlation functions for the 5.03 GHz and 15.15 GHz FSR singly filtered BFCs with cavity finesse F of 10.93 [experiment data for cavity finesse F of 10.93 shown in the inset of Fig. 1(b)], 30, 11.14, and 30, respectively. For calculations in (a) and (b), the FWHM timing jitter of the single-photon detector is set at 20 ps. (c) and (d) Modeled Franson recurrence visibilities for the 5.03 GHz and 15.15 GHz FSR singly filtered BFCs with varied cavity finesses F of 10.93, 30, 11.14, and 30. Note that for 5.03 GHz FSR with a cavity finesses F of 10.93 GHz, and for 15.15 GHz FSR with a cavity finesse F of 11.14 singly filtered BFCs, our measurement results are provided in Fig. 2. Due to the increasing probability of detecting mode-locked temporal oscillations at the single-photon detector with a cavity finesse F of 30, the Franson interference recurrence visibilities increase correspondingly. This exemplifies that the cavity finesse F is a key parameter for optimizing the temporal correlations and Franson interference recurrence of the mode-locked biphoton states. (e) Experimentally measured Franson interference recurrence using a 15.11 GHz FSR, cavity finesse F 45.92 singly filtered BFC. a*–f* Franson recurrence interference fringes with six discrete time bins measured in a 45.92 cavity finesse F singly filtered BFC. The experimentally measured (theoretical) visibilities for the six time bins (in red) for the 15.11 GHz FSR singly filtered BFC are 98.76% (100%), 92.69% (93.39%), 86.45% (87.21%), 80.64% (81.45%), 75.01% (76.06%), and 69.86% (71.03%), respectively. All measurements are performed with a coincidence window of 2 ns and the reported visibilities are after subtracting accidental coincidences.
    Fig. 3. Modeled and experimental mode-locking oscillations, Franson revival visibilities for 5.03 GHz, 15.15 GHz, and 15.11 GHz FSR singly filtered BFCs. (a) and (b) Theoretical signal-idler cross-correlation functions for the 5.03 GHz and 15.15 GHz FSR singly filtered BFCs with cavity finesse F of 10.93 [experiment data for cavity finesse F of 10.93 shown in the inset of Fig. 1(b)], 30, 11.14, and 30, respectively. For calculations in (a) and (b), the FWHM timing jitter of the single-photon detector is set at 20 ps. (c) and (d) Modeled Franson recurrence visibilities for the 5.03 GHz and 15.15 GHz FSR singly filtered BFCs with varied cavity finesses F of 10.93, 30, 11.14, and 30. Note that for 5.03 GHz FSR with a cavity finesses F of 10.93 GHz, and for 15.15 GHz FSR with a cavity finesse F of 11.14 singly filtered BFCs, our measurement results are provided in Fig. 2. Due to the increasing probability of detecting mode-locked temporal oscillations at the single-photon detector with a cavity finesse F of 30, the Franson interference recurrence visibilities increase correspondingly. This exemplifies that the cavity finesse F is a key parameter for optimizing the temporal correlations and Franson interference recurrence of the mode-locked biphoton states. (e) Experimentally measured Franson interference recurrence using a 15.11 GHz FSR, cavity finesse F 45.92 singly filtered BFC. a*f* Franson recurrence interference fringes with six discrete time bins measured in a 45.92 cavity finesse F singly filtered BFC. The experimentally measured (theoretical) visibilities for the six time bins (in red) for the 15.11 GHz FSR singly filtered BFC are 98.76% (100%), 92.69% (93.39%), 86.45% (87.21%), 80.64% (81.45%), 75.01% (76.06%), and 69.86% (71.03%), respectively. All measurements are performed with a coincidence window of 2 ns and the reported visibilities are after subtracting accidental coincidences.
    Towards optimum mode-locked oscillations, Franson interference recurrence, and time-bin Schmidt number KT in 15 GHz singly filtered BFCs. (a) Theoretical signal-idler cross-correlation peak values for 15.15 GHz FSR singly filtered BFCs with cavity finesse F of 11.14, 30, 50, 100, and 200, respectively. (b) Franson recurrence visibilities and time-bin Schmidt number KT for 15.15 GHz FSR singly filtered BFC with cavity finesse F of 11.14, 30, 50, 100, and 200, respectively. The experimentally measured Franson visibilities (orange stars) are superimposed for a 15.15 GHz FSR cavity with a finesse F of 11.14, and a 15.11 GHz FSR cavity with a higher finesse F of 45.92, respectively. The measured sixth time-bin Franson visibility for a 15.11 GHz FSR cavity with a higher finesse F of 45.92 is 69.86% (71.03% for theoretical visibility) after subtracting accidental coincidences, which is close to the visibility of the quantum-classical limit of 70.7% (the black dotted line). Here, by using a higher cavity finesse F of 45.92, we observe an experimental ≈3.13-fold improvement of the Franson visibility compared to the Franson visibility with a cavity finesse F of 11.14 at the sixth time bin. Besides, for the 16th time bin in same BFC, there is a potential ≈24-fold improvement of the Franson visibility for a cavity finesse F of 45.92 compared to the Franson visibility with a cavity finesse F of 11.14. As cavity finesse F increases to 200 for the 16th time bin, the time-bin Schmidt number KT becomes ≈16, which is because the Franson revival visibility approaches optimum limit of 100%. The light green and yellow bars represent the theoretical time-bin Schmidt number KT from the Franson recurrence visibilities up to 6th and 16th time bins, respectively. The deep red dotted lines are the experimental time-bin Schmidt number KT at the sixth time bin.
    Fig. 4. Towards optimum mode-locked oscillations, Franson interference recurrence, and time-bin Schmidt number KT in 15 GHz singly filtered BFCs. (a) Theoretical signal-idler cross-correlation peak values for 15.15 GHz FSR singly filtered BFCs with cavity finesse F of 11.14, 30, 50, 100, and 200, respectively. (b) Franson recurrence visibilities and time-bin Schmidt number KT for 15.15 GHz FSR singly filtered BFC with cavity finesse F of 11.14, 30, 50, 100, and 200, respectively. The experimentally measured Franson visibilities (orange stars) are superimposed for a 15.15 GHz FSR cavity with a finesse F of 11.14, and a 15.11 GHz FSR cavity with a higher finesse F of 45.92, respectively. The measured sixth time-bin Franson visibility for a 15.11 GHz FSR cavity with a higher finesse F of 45.92 is 69.86% (71.03% for theoretical visibility) after subtracting accidental coincidences, which is close to the visibility of the quantum-classical limit of 70.7% (the black dotted line). Here, by using a higher cavity finesse F of 45.92, we observe an experimental 3.13-fold improvement of the Franson visibility compared to the Franson visibility with a cavity finesse F of 11.14 at the sixth time bin. Besides, for the 16th time bin in same BFC, there is a potential 24-fold improvement of the Franson visibility for a cavity finesse F of 45.92 compared to the Franson visibility with a cavity finesse F of 11.14. As cavity finesse F increases to 200 for the 16th time bin, the time-bin Schmidt number KT becomes 16, which is because the Franson revival visibility approaches optimum limit of 100%. The light green and yellow bars represent the theoretical time-bin Schmidt number KT from the Franson recurrence visibilities up to 6th and 16th time bins, respectively. The deep red dotted lines are the experimental time-bin Schmidt number KT at the sixth time bin.
    Details of the experimental scheme for generating singly filtered BFCs. For our continuous-wave pumped source, we customize a tunable stabilized self-injection-locked 658 nm laser to achieve single-longitudinal mode lasing with wavelength tunability of several nanometers for optimizing the photon flux. We couple our tunable continuous-wave laser operating at ≈2 mW and ≈658 nm into a 1.6 cm long ppKTP waveguide, temperature controlled to 26.5°C for SPDC under type-II phase matching [2–5" target="_self" style="display: inline;">–5]. Then, three-fiber FP cavities are placed in the signal path for singly filtered BFCs generation. We carefully tune the fiber cavity temperature to align its transmission peaks with the generated entangled photons to maximize the coincidences of our singly filtered BFCs. LPF, long-pass filter; BPF, band-pass filter; FPC, fiber polarization controller; FPBS, fiber polarizing beam splitter.
    Fig. 5. Details of the experimental scheme for generating singly filtered BFCs. For our continuous-wave pumped source, we customize a tunable stabilized self-injection-locked 658 nm laser to achieve single-longitudinal mode lasing with wavelength tunability of several nanometers for optimizing the photon flux. We couple our tunable continuous-wave laser operating at 2  mW and 658  nm into a 1.6 cm long ppKTP waveguide, temperature controlled to 26.5°C for SPDC under type-II phase matching [25" target="_self" style="display: inline;">5]. Then, three-fiber FP cavities are placed in the signal path for singly filtered BFCs generation. We carefully tune the fiber cavity temperature to align its transmission peaks with the generated entangled photons to maximize the coincidences of our singly filtered BFCs. LPF, long-pass filter; BPF, band-pass filter; FPC, fiber polarization controller; FPBS, fiber polarizing beam splitter.
    Signature of Franson interference in the quantum regime. The phases for the measurements reported in (a) and (c) are such that the middle peak was maximized and minimized, respectively. By postselecting the central correlation peak and changing the phases of the interferometers (ΔT1), we obtain a maximum Franson visibility for the 0th time bin over 98.99% in a 15.15 GHz FSR singly filtered BFC after subtracting accidental coincidences.
    Fig. 6. Signature of Franson interference in the quantum regime. The phases for the measurements reported in (a) and (c) are such that the middle peak was maximized and minimized, respectively. By postselecting the central correlation peak and changing the phases of the interferometers (ΔT1), we obtain a maximum Franson visibility for the 0th time bin over 98.99% in a 15.15 GHz FSR singly filtered BFC after subtracting accidental coincidences.
    Measured Franson interferences at noninteger cavity round-trip times in the 5.03 GHz and 15.15 GHz FSR mode-locked singly filtered BFCs. When we translate the motorized stage with a ΔT2 that is noninteger cavity round-trip time, such as 360 ps, we observe an absence of the Franson interference fringes for 5.03 GHz FSR and 15.15 GHz FSR singly filtered BFCs in (a) and (b), respectively. This confirms the Franson interference recurrence only occurs when temporal delay is equal to integer of cavity round-trip times.
    Fig. 7. Measured Franson interferences at noninteger cavity round-trip times in the 5.03 GHz and 15.15 GHz FSR mode-locked singly filtered BFCs. When we translate the motorized stage with a ΔT2 that is noninteger cavity round-trip time, such as 360 ps, we observe an absence of the Franson interference fringes for 5.03 GHz FSR and 15.15 GHz FSR singly filtered BFCs in (a) and (b), respectively. This confirms the Franson interference recurrence only occurs when temporal delay is equal to integer of cavity round-trip times.
    Modeling of the signal-idler temporal second-order cross-correlation function and Franson revivals visibility for a 50 GHz FSR cavity singly filtered mode-locked BFC with different finesses F. In (a), we model the signal-idler temporal second-order cross-correlation function versus four different cavity finesses F in a 50 GHz FSR cavity with an FWHM timing jitter of 20 ps. In (b), we plot the Franson interference recurrences for four different cavity finesses F of 30, 100, 200, and 500 in the same temporal range.
    Fig. 8. Modeling of the signal-idler temporal second-order cross-correlation function and Franson revivals visibility for a 50 GHz FSR cavity singly filtered mode-locked BFC with different finesses F. In (a), we model the signal-idler temporal second-order cross-correlation function versus four different cavity finesses F in a 50 GHz FSR cavity with an FWHM timing jitter of 20 ps. In (b), we plot the Franson interference recurrences for four different cavity finesses F of 30, 100, 200, and 500 in the same temporal range.
    Kai-Chi Chang, Xiang Cheng, Murat Can Sarihan, Chee Wei Wong. Towards optimum Franson interference recurrence in mode-locked singly-filtered biphoton frequency combs[J]. Photonics Research, 2023, 11(7): 1175
    Download Citation