
Zhenhong Huang, Xuejuan Hu, Lingling Chen, Liang Hu, Lu Xu, Lijin Lian. Dense Cell Recognition and Tracking Based on Mask R-CNN and DeepSort[J]. Laser & Optoelectronics Progress, 2022, 59(18): 1811004
- Laser & Optoelectronics Progress
- Vol. 59, Issue 18, 1811004 (2022)
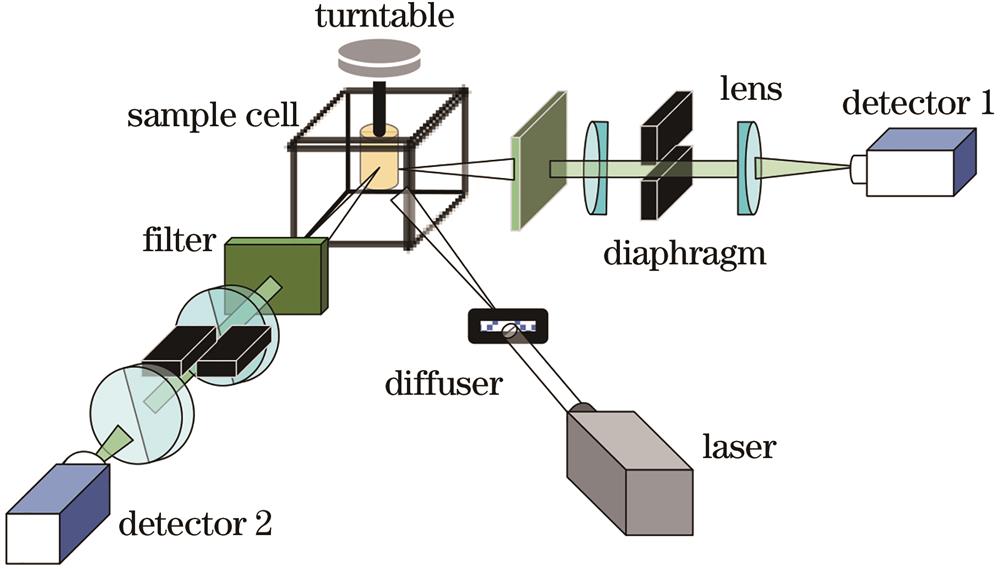
Fig. 1. Angularly multiplexed OPT system
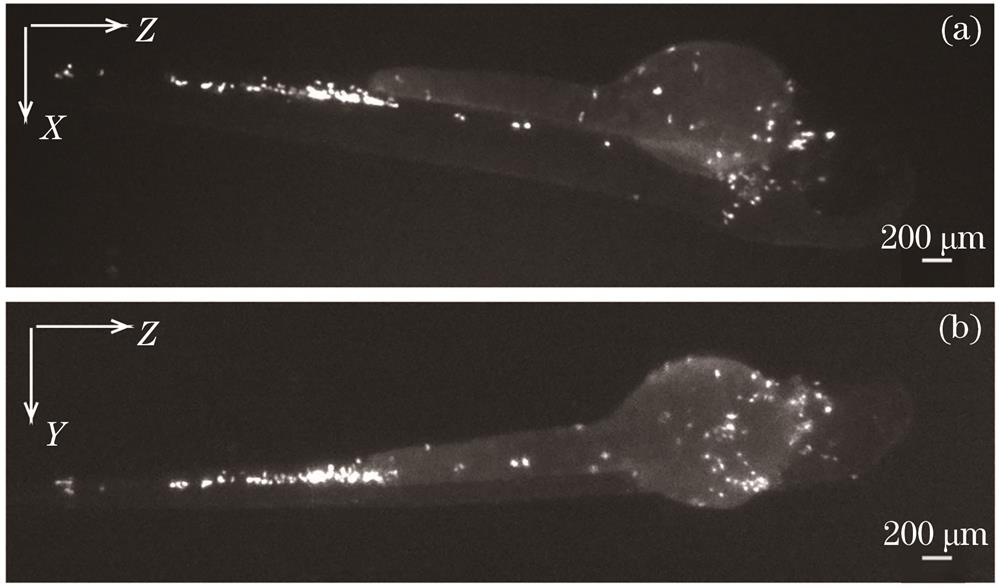
Fig. 2. Reconstructed cell images. (a) XZ direction; (b) YZ direction
Fig. 3. Flow chart of zebrafish cell identification and tracking model
Fig. 4. Structure diagram of zebrafish cell recognition and tracking model
Fig. 5. Three-dimensional cell tracking framework
Fig. 6. Three-dimensional tracking algorithm flow chart
Fig. 7. Mask generated by Labelme. (a) Original map of cells; (b) mask map
Fig. 8. Data augmentation (a) Original; (b) distortion; (c) overturn; (d) add noise
Fig. 9. Comparison of loss and mAP under different learning rates. (a) Training loss under different learning rates; (b) validation loss under different learning rates; (c) mAP under different learning rates
Fig. 10. mAP change curves under different improvement losses
Fig. 11. Loss of 606 training sets when learning rate is 0.001
Fig. 12. Local comparison of segmentation results. (a) Original cell image; (b) watershed segmentation based on gradient transformation; (c) morphological segmentation; (d) segmentation based on U-Net; (e) segmentation based on Mask R-CNN; (f) segmentation based on Mask R-CNN++
Fig. 13. Effect of segmentation in data augmentation. (a) Distortion; (b) add noise; (c) overturn
Fig. 14. Results of tracking by DeepSort. (a) Part of cells in 20th frame; (b) part of cells in 30th frame
Fig. 15. Cell trajectory (a) Three-dimentional trajectory map of cells; (b) position of cell relative to Z axis of first frame changes
|
Table 1. Parameter setting of network
|
Table 2. Time efficiency and part of the model mAP under different learning rates
| ||||||||||||||||||||||||||||||||||
Table 3. Precision and recall of cell segmentation by different algorithms

Set citation alerts for the article
Please enter your email address
© Copyright 2018-2021 | Chinese Laser Press. All Rights Reserved 沪ICP备15018463号-20