• High Power Laser Science and Engineering
  • Vol. 9, Issue 2, 02000e34 (2021)
M. G. Capeluto1、2, A. Curtis1, C. Calvi3, R. Hollinger1, V. N. Shlyaptsev1, and J. J. Rocca1、3、*
Author Affiliations
  • 1Electrical and Computer Engineering Department, Colorado State University, Fort Collins, CO80523, USA
  • 2Departamento de Física, Universidad de Buenos Aires-IFIBA, 1428Buenos Aires, Argentina
  • 3Physics Department, Colorado State University, Fort Collins, CO80523, USA
  • show less
    DOI: 10.1017/hpl.2021.21 Cite this Article Set citation alerts
    M. G. Capeluto, A. Curtis, C. Calvi, R. Hollinger, V. N. Shlyaptsev, J. J. Rocca. Deuterated polyethylene nanowire arrays for high-energy density physics[J]. High Power Laser Science and Engineering, 2021, 9(2): 02000e34 Copy Citation Text show less
    Procedure for the fabrication of CD2 NW arrays. (a) A CD2 thin film is extruded through the pores of an AAO template at a pressure P and selected temperatures between 130°C and 230°C. (b) The sample is mounted on a carbon stub, subsequently the template is dissolved in NaOH at 50°C, and (c) the NWs are dried in an SPD. (d) SEM image of an array of vertically aligned CD2 NWs.
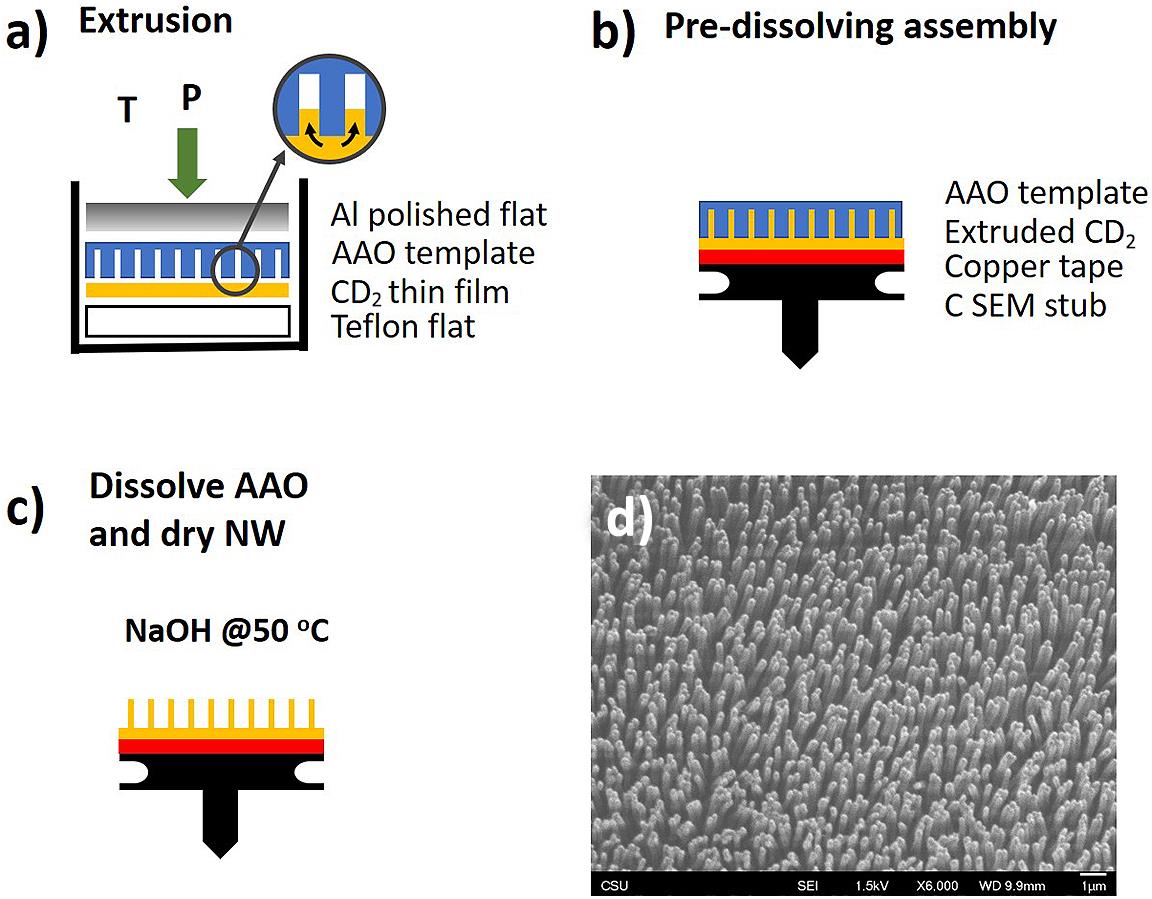
    Fig. 1. Procedure for the fabrication of CD2 NW arrays. (a) A CD2 thin film is extruded through the pores of an AAO template at a pressure P and selected temperatures between 130°C and 230°C. (b) The sample is mounted on a carbon stub, subsequently the template is dissolved in NaOH at 50°C, and (c) the NWs are dried in an SPD. (d) SEM image of an array of vertically aligned CD2 NWs.
    (a) Schematic representation of an NW target mounted on the van der Graaf generator dome. (b), (c) SEM images of a sample before and after charging, respectively.
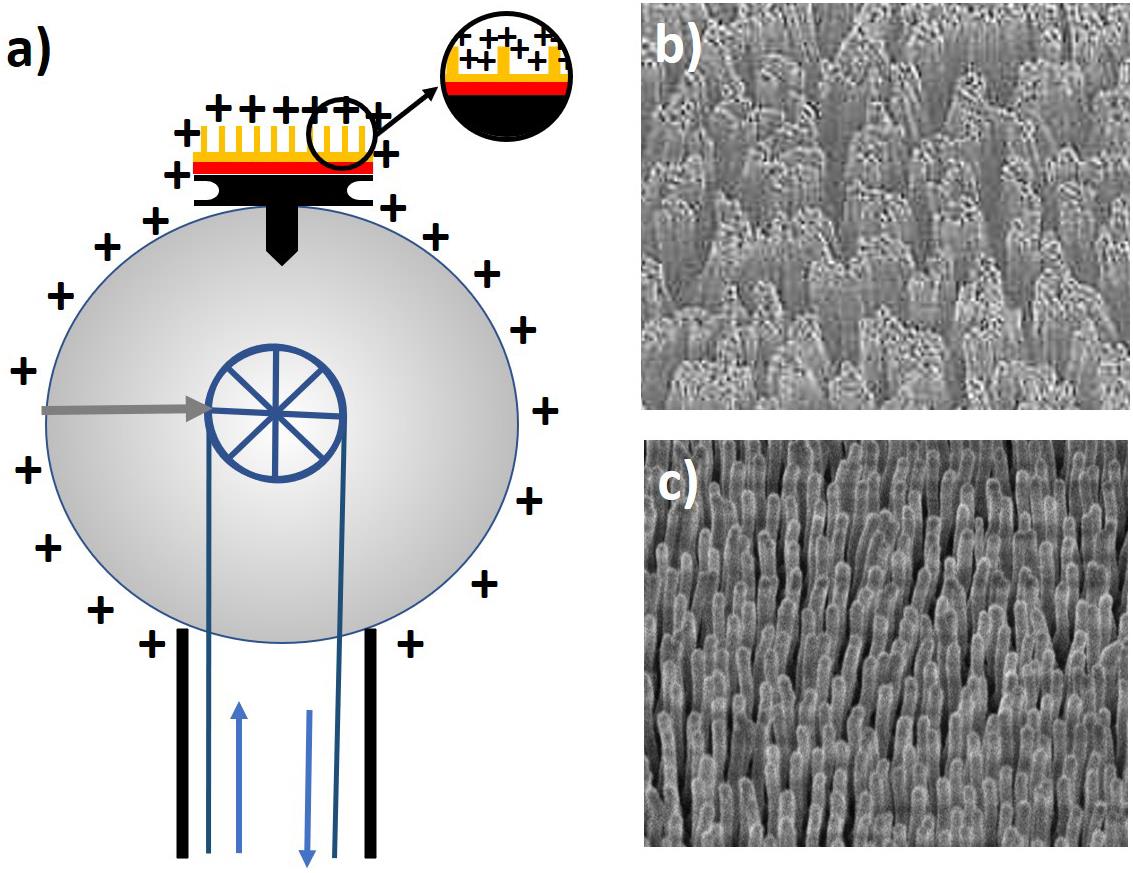
    Fig. 2. (a) Schematic representation of an NW target mounted on the van der Graaf generator dome. (b), (c) SEM images of a sample before and after charging, respectively.
    (a) Experimental setup for ion energy spectra and neutron measurements. Femtosecond laser pulses of relativistic intensity are focused onto CD2 targets. A Thompson parabola is used to determine the energy spectra of the accelerated ions. The neutron flux is detected using an array of four scintillator/ photomultiplier neutron time of flight detectors (in the detectors: gray, lead; orange, scintillator). (b), (d) TPIS ion traces and (c), (e) deuteron energy spectra corresponding to an NW target and a flat target, respectively. The irradiation intensity is approximately 3 × 10²¹ W cm–2.
    Fig. 3. (a) Experimental setup for ion energy spectra and neutron measurements. Femtosecond laser pulses of relativistic intensity are focused onto CD2 targets. A Thompson parabola is used to determine the energy spectra of the accelerated ions. The neutron flux is detected using an array of four scintillator/ photomultiplier neutron time of flight detectors (in the detectors: gray, lead; orange, scintillator). (b), (d) TPIS ion traces and (c), (e) deuteron energy spectra corresponding to an NW target and a flat target, respectively. The irradiation intensity is approximately 3 × 10²¹ W cm–2.
    (a) Experimental setup used to measure the angular distributions of deuterons with cutoff energies of less than 1.3 MeV energy. Filtered CR39 detectors are placed at the end of the vacuum tubes, at 195 cm from the target. (b) Measured angular distribution for deuterons with cutoff energies of 1 MeV and 1.3 MeV. (c) Similar data for deuterons with cutoff energies of 0.3 MeV and 0.4 MeV obtained at 300 cm from the target.
    Fig. 4. (a) Experimental setup used to measure the angular distributions of deuterons with cutoff energies of less than 1.3 MeV energy. Filtered CR39 detectors are placed at the end of the vacuum tubes, at 195 cm from the target. (b) Measured angular distribution for deuterons with cutoff energies of 1 MeV and 1.3 MeV. (c) Similar data for deuterons with cutoff energies of 0.3 MeV and 0.4 MeV obtained at 300 cm from the target.
    Time-of-flight neutron detector signals for a CD2 NW (blue trace) array and solid flat target (red trace). The amplitude of the red trace is multiplied by a factor of 10 for clarity. The histogram shows the average number of neutrons generated from 11 laser shots in each case. The neutron yield is approximately 500 times larger in the case of NWs. The data corresponds to an irradiation intensity of 8 × 10¹⁹ W cm–2 (after Curtis et al.[26" target="_self" style="display: inline;">26]).
    Fig. 5. Time-of-flight neutron detector signals for a CD2 NW (blue trace) array and solid flat target (red trace). The amplitude of the red trace is multiplied by a factor of 10 for clarity. The histogram shows the average number of neutrons generated from 11 laser shots in each case. The neutron yield is approximately 500 times larger in the case of NWs. The data corresponds to an irradiation intensity of 8 × 10¹⁹ W cm–2 (after Curtis et al.[26]).
    M. G. Capeluto, A. Curtis, C. Calvi, R. Hollinger, V. N. Shlyaptsev, J. J. Rocca. Deuterated polyethylene nanowire arrays for high-energy density physics[J]. High Power Laser Science and Engineering, 2021, 9(2): 02000e34
    Download Citation