Author Affiliations
1Beijing Institute of Space Mechanics and Electricity, Beijing 100094, China2Key Laboratory for Space Laser Information Perception Technology, China Academy of Space Technology, Beijing 100094, Chinashow less
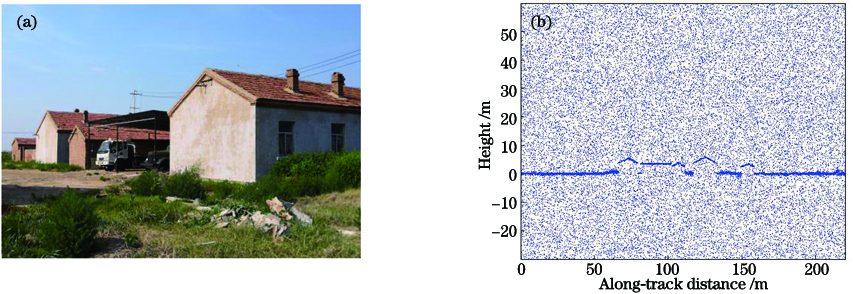
Fig. 1. Airport building photos and point cloud data. (a) Airport building; (b) point cloud data
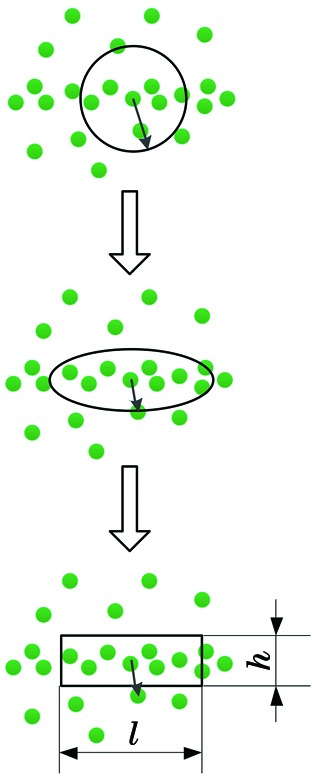
Fig. 2. Change process of the search area shape
Fig. 3. Flow of the denoising algorithm
Fig. 4. Statistical histogram of the neighborhood density
Fig. 5. Neighborhood density of noise points after fitting
Fig. 6. Denoising result of the point cloud. (a) Noise and signal points after processing; (b) partial enlarged view
Fig. 7. Fitting result of the airport building contour
Fig. 8. Processing results of the MABEL point cloud data. (a) No.6; (b) No.8; (c) No.3; (d) No.9
Serial number | Number of signal points | Standard deviation /m |
---|
1 | 90 | 0.21 | 2 | 104 | 0.23 | 3 | 632 | 0.13 | 4 | 70 | 0.15 | 5 | 81 | 0.27 | 6 | 107 | 0.24 | 7 | 99 | 0.18 | 8 | 86 | 0.16 | 9 | 75 | 0.22 | Sum | 1344 | 0.18 |
|
Table 1. Fitting error of the airport building contour
θ/(°) | h/m | l/m | μ | σ | FP | FN | TP | R/% | P/% |
---|
3 | 0.22 | 4.2 | 6.5 | 2.3 | 114 | 52 | 2929 | 98.26 | 96.25 | 5 | 0.28 | 3.2 | 6.5 | 2.3 | 152 | 18 | 2957 | 99.39 | 95.11 | 10 | 0.40 | 2.3 | 6.5 | 2.3 | 179 | 4 | 2981 | 99.87 | 94.34 |
|
Table 2. Effect of θ on algorithm recognition rate and accuracy
θ/(°) | h/m | l/m | μ | σ | FP | FN | TP | R/% | P/% |
---|
5 | 0.28 | 3.2 | 6.5 | 2.3 | 152 | 18 | 2957 | 99.39 | 95.11 | 5 | 0.35 | 4.0 | 9.4 | 2.9 | 168 | 27 | 2944 | 99.09 | 94.60 | 5 | 0.42 | 4.8 | 13.0 | 3.5 | 307 | 41 | 2921 | 98.62 | 90.49 |
|
Table 3. Effect of search area on algorithm recognition rate and accuracy
Serial number | Flight time | Scenario | Number of points |
---|
1 | 20120412T1644 | northwest Greenland | 25001 | 2 | 20120412T1659 | central Greenland | 50000 | 3 | 20120420T0954 | sea ice around Greenland | 40000 | 4 | 20120420T1004 | edge of Greenland | 50001 | 5 | 20120915T2300 | water | 15113 | 6 | 20130919T1512 | vegetation, day | 30108 | 7 | 20130920T2225 | vegetation, night | 33759 | 8 | 20130927T1856 | land | 56201 | 9 | 20140729T2106 | north pole | 40690 |
|
Table 4. MABEL point cloud data
Serial number | θ/(°) | h/m | l/m | μ | σ | FP | FN | TP | R/% | P/% |
---|
1 | 5 | 2.6 | 30.0 | 5.4 | 2.0 | 267 | 33 | 3948 | 99.17 | 93.67 | 2 | 5 | 2.6 | 30.0 | 6.6 | 2.3 | 174 | 4 | 1804 | 99.78 | 91.20 | 3 | 5 | 2.6 | 30.0 | 6.3 | 2.2 | 138 | 2 | 1316 | 99.85 | 90.51 | 4 | 5 | 2.6 | 30.0 | 6.6 | 2.3 | 132 | 3 | 1300 | 99.77 | 90.78 | 5 | 5 | 13.1 | 150.0 | 4.3 | 1.8 | 435 | 1 | 7426 | 99.99 | 94.47 | 6 | 5 | 3.9 | 45.0 | 4.7 | 1.9 | 60 | 221 | 5649 | 96.24 | 98.95 | 7 | 5 | 7.9 | 90.0 | 5.3 | 2.0 | 142 | 59 | 19148 | 99.69 | 99.26 | 8 | 5 | 3.1 | 35.0 | 5.6 | 2.2 | 352 | 230 | 3748 | 94.22 | 91.41 | 9 | 5 | 3.1 | 35.0 | 6.3 | 2.3 | 201 | 30 | 1842 | 98.40 | 90.16 |
|
Table 5. Processing parameters and results of MABEL point cloud data