• Chinese Optics Letters
  • Vol. 21, Issue 3, 031202 (2023)
Guang Feng1, Zhihui Chen1、*, Yang Wang2, Xin Liu1, Yinshan Liu1, Xiao Liu1, Fei Sun1, Yibiao Yang1, and Shuqi Chen3、**
Author Affiliations
  • 1Key Laboratory of Advanced Transducers and Intelligent Control System, Ministry of Education and Shanxi Province, College of Physics and Optoelectronics, Taiyuan University of Technology, Taiyuan 030024, China
  • 2Key Laboratory of Chemical Biology and Molecular Engineering, Ministry of Education, Institute of Biotechnology, Shanxi University, Taiyuan 030006, China
  • 3Key Laboratory of Weak Light Nonlinear Photonics, Ministry of Education, Renewable Energy Conversion and Storage Center, School of Physics and TEDA Institute of Applied Physics, Nankai University, Tianjin 300071, China
  • show less
    DOI: 10.3788/COL202321.031202 Cite this Article Set citation alerts
    Guang Feng, Zhihui Chen, Yang Wang, Xin Liu, Yinshan Liu, Xiao Liu, Fei Sun, Yibiao Yang, Shuqi Chen. Enhanced Fano resonance for high-sensitivity sensing based on bound states in the continuum[J]. Chinese Optics Letters, 2023, 21(3): 031202 Copy Citation Text show less
    (a) Three-dimensional structure diagram; (b) plan view of structure unit.
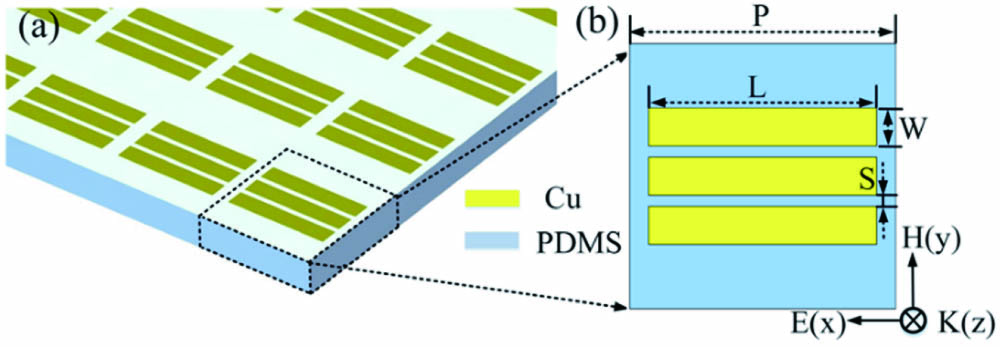
    Fig. 1. (a) Three-dimensional structure diagram; (b) plan view of structure unit.
    Fabrication for the proposed structure.
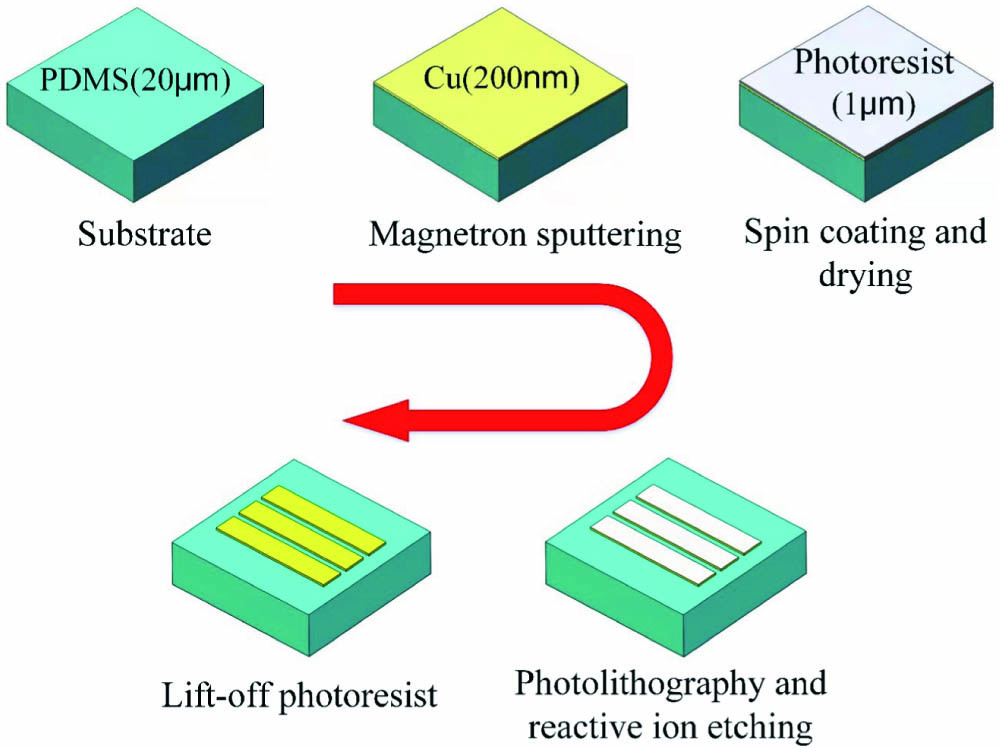
    Fig. 2. Fabrication for the proposed structure.
    (a) Color plot of the transmission spectra with different lengths of metal bars; (b) transmission when the lengths of the metal bars are from 50 to 66 µm; (c) fitting curve of Fano resonance when the length of L is 56 µm; (d) transmission of MICMT and simulation when the lengths of the metal bars are 62, 60, and 58 µm, respectively. By curve fitting, the decay time of the internal losses, respectively, are about τ10 = 4000 fs, τ20 = 8000 fs, and τ30 = 500 fs. The decay time of coupling and the total coupling phases, respectively, are about τ1 = 400 fs, τ2 = 8000 fs, τ3 = 250 s, φ1 = 0.2π, φ2 = −0.3π, φ3 = −0.1π; τ1 = 400 fs, τ3 = 250 s, φ1 = 0.2π, φ3 = −0.1π; τ1 = 400 fs, τ2 = 8000 fs, τ3 = 250 s, φ1 = 0.2π, φ2 = −0.3π, φ3 = −0.1π. (e) Quadrupole modes and (f) dipole modes when the lengths of the metal bars are 55 µm.
    Fig. 3. (a) Color plot of the transmission spectra with different lengths of metal bars; (b) transmission when the lengths of the metal bars are from 50 to 66 µm; (c) fitting curve of Fano resonance when the length of L is 56 µm; (d) transmission of MICMT and simulation when the lengths of the metal bars are 62, 60, and 58 µm, respectively. By curve fitting, the decay time of the internal losses, respectively, are about τ10 = 4000 fs, τ20 = 8000 fs, and τ30 = 500 fs. The decay time of coupling and the total coupling phases, respectively, are about τ1 = 400 fs, τ2 = 8000 fs, τ3 = 250 s, φ1 = 0.2π, φ2 = −0.3π, φ3 = −0.1π; τ1 = 400 fs, τ3 = 250 s, φ1 = 0.2π, φ3 = −0.1π; τ1 = 400 fs, τ2 = 8000 fs, τ3 = 250 s, φ1 = 0.2π, φ2 = −0.3π, φ3 = −0.1π. (e) Quadrupole modes and (f) dipole modes when the lengths of the metal bars are 55 µm.
    (a) Single, double, and triple metal bars structure unit; (b) FWHM under different lengths; (c) ratio of Fano intensity to FWHM under different lengths; (d) Fano intensity, Q factor, and Q × I under different lengths.
    Fig. 4. (a) Single, double, and triple metal bars structure unit; (b) FWHM under different lengths; (c) ratio of Fano intensity to FWHM under different lengths; (d) Fano intensity, Q factor, and Q × I under different lengths.
    Simulated field enhancement of the triple metal bars. (a) and (b) show color plots of the field enhancement for different lengths in the triple metal bars, respectively; (c) electric field enhancement and (d) magnetic field enhancement for the lengths of 53, 55, 59, and 60 µm in the triple metal bars, respectively; (e) electric field enhancement and (f) magnetic field enhancement corresponding to the green dotted lines in (a) and (b), respectively.
    Fig. 5. Simulated field enhancement of the triple metal bars. (a) and (b) show color plots of the field enhancement for different lengths in the triple metal bars, respectively; (c) electric field enhancement and (d) magnetic field enhancement for the lengths of 53, 55, 59, and 60 µm in the triple metal bars, respectively; (e) electric field enhancement and (f) magnetic field enhancement corresponding to the green dotted lines in (a) and (b), respectively.
    (a), (d), (g) Electric, (b), (e), (h) magnetic fields, and (c), (f), (i) surface current at the Fano resonance. (a), (b), (c) The length is 59 µm; (d), (e), (f) the length is 55 µm; (g), (h), (i) the length is 50 µm.
    Fig. 6. (a), (d), (g) Electric, (b), (e), (h) magnetic fields, and (c), (f), (i) surface current at the Fano resonance. (a), (b), (c) The length is 59 µm; (d), (e), (f) the length is 55 µm; (g), (h), (i) the length is 50 µm.
    (a) Dependence of transmission on the refractive index increased from 1.3 to 1.6 under the thickness of 70 µm; (b) dependence of transmission on the analyte thickness increased from 10 to 70 µm under the refractive index of 1.6; (c) frequency shift under different refractive indices of analyte extracted from (a); (d) frequency shift under different analyte thicknesses extracted from (b).
    Fig. 7. (a) Dependence of transmission on the refractive index increased from 1.3 to 1.6 under the thickness of 70 µm; (b) dependence of transmission on the analyte thickness increased from 10 to 70 µm under the refractive index of 1.6; (c) frequency shift under different refractive indices of analyte extracted from (a); (d) frequency shift under different analyte thicknesses extracted from (b).
    Angular response for the triple metal bar length of 55 µm: (a) simulated transmission contour plot under TM-polarized incidence; (b) simulated transmission curves with incidence angles from 10° to 24°; (c) field distribution of Mode 1 and Mode 2 at 10° and 24°, respectively.
    Fig. 8. Angular response for the triple metal bar length of 55 µm: (a) simulated transmission contour plot under TM-polarized incidence; (b) simulated transmission curves with incidence angles from 10° to 24°; (c) field distribution of Mode 1 and Mode 2 at 10° and 24°, respectively.
    StructureIndex SensitivityFOMYear
    Two silicon cuboids465.74 GHz/RIU10,0002022[28]
    Double metal split ring resonators455.7 GHz/RIU<502019[37]
    Three gold blocks165 GHz/RIU<502021[26]
    Double metal split ring resonators775.7 GHz/RIU2842022[38]
    Triple metal rods1877 GHz/RIU665This work
    Table 1. Properties of BIC-Based Metasurface Sensors
    Guang Feng, Zhihui Chen, Yang Wang, Xin Liu, Yinshan Liu, Xiao Liu, Fei Sun, Yibiao Yang, Shuqi Chen. Enhanced Fano resonance for high-sensitivity sensing based on bound states in the continuum[J]. Chinese Optics Letters, 2023, 21(3): 031202
    Download Citation