• Spectroscopy and Spectral Analysis
  • Vol. 42, Issue 5, 1372 (2022)
Rong-hua JI1、*, Ying-ying ZHAO2、2;, Min-zan LI2、2;, and Li-hua ZHENG2、2; *;
Author Affiliations
  • 11. Yantai Research Institute of China Agricultural University, Yantai 264670, China
  • 22. Key Laboratory of Modern Precision Agriculture System Integration Research, Ministry of Education, China Agricultural University, Beijing 100083, China
  • show less
    DOI: 10.3964/j.issn.1000-0593(2022)05-1372-06 Cite this Article
    Rong-hua JI, Ying-ying ZHAO, Min-zan LI, Li-hua ZHENG. Research on Prediction Model of Soil Nitrogen Content Based on Encoder-CNN[J]. Spectroscopy and Spectral Analysis, 2022, 42(5): 1372 Copy Citation Text show less
    Correlation between soil nitrogen content and self-collected spectrum and its differential spectrum(a): The original spectrum; (b): The first order differential spectrum; (c): The second order differential spectrum
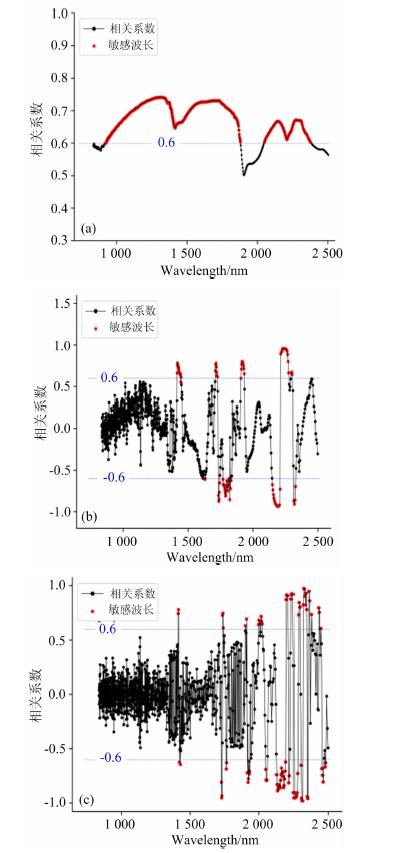
    Fig. 1. Correlation between soil nitrogen content and self-collected spectrum and its differential spectrum
    (a): The original spectrum; (b): The first order differential spectrum; (c): The second order differential spectrum
    The basic structure of auto-encoder
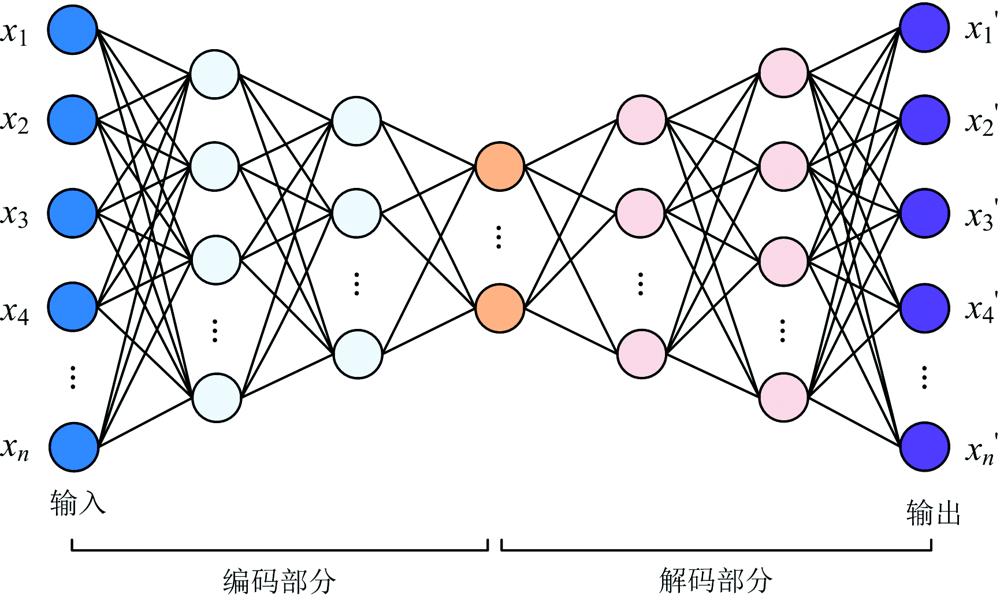
    Fig. 2. The basic structure of auto-encoder
    The schematic diagram of CNN network structure
    Fig. 3. The schematic diagram of CNN network structure
    Changes of evaluation indexes of CNN-3 model(a): Coefficient of determination; (b): Root-mean-square error; (c): Relative percent deviation
    Fig. 4. Changes of evaluation indexes of CNN-3 model
    (a): Coefficient of determination; (b): Root-mean-square error; (c): Relative percent deviation
    The model prediction performance on Heilongjiang data set (900 iterations)
    Fig. 5. The model prediction performance on Heilongjiang data set (900 iterations)
    光谱数据强相关波段/nm
    原始光谱918.7~1 878.7, 2 047.9~2 378.5
    一阶微分光谱1 356.0~1 448.4, 1 624.4~1 628.5,
    1 710.2~1 726.1,1 733~1 742.3,
    1 768.5~1 830.9, 1 906.3~1 931.9,
    2 149.8~2 274.2, 2 294.3~2 298.4,
    2 314.8~2 327.3
    二阶微分光谱1 412.2~1 427.6, 1 726.1~1 740,
    1 742.3~1 771, 1 920.4~1 931.9,
    1 997.4~2 025.5, 2 128.6~2 374.2,
    2 427.5~2 441.2, 2 450.5~2 459.8,
    2 473.9~2 478.6
    Table 1. List of strongly correlated wavebands for spectral data
    特征波段/nm波长间隔/nm波长数量
    1 356.0~1 448.41.562
    1 624.4~1 628.52.03
    1 710.2~1 830.92.451
    2 128.6~2 374.23.864
    Table 2. Characteristic bands and model input wavelength selection
    结构
    编号
    网络名称神经元个数R2
    输入层隐含层1隐含层2隐含层3
    1AutoEnc1
    AutoEnc2
    18030
    60
    -
    -
    -
    -
    0.638
    0.485
    2AutoEnc3
    AutoEnc4
    AutoEnc5
    18060
    90
    120
    30
    30
    30
    -
    -
    -
    0.802
    0.857
    0.952
    3AutoEnc6
    AutoEnc7
    AutoEnc8
    180120
    120
    120
    60
    60
    90
    -
    30
    30
    0.910
    0.999
    0.951
    Table 3. Spectral reconstruction effect of different automatic encoder structures
    网络层编号网络结构1网络结构2
    CNN-1CNN-2CNN-1CNN-2
    数量尺寸数量尺寸数量尺寸数量尺寸
    卷积层
    (卷积核)
    15127×75127×75127×75127×7
    2643×35121×15121×15121×1
    3643×31283×31283×31283×3
    4643×31281×11281×11281×1
    5641×12561×12561×12561×1
    6641×1643×3643×3643×3
    7641×1641×1641×1641×1
    全连接层
    (神经元)
    164-64-64-256-
    264-64-64-128-
    Table 4. The parameters setting of convolution layers
    网络
    结构
    模型LUCAS数据集黑龙江数据集
    训练集测试集
    R2RMSERPDR2RMSERPDR2RMSERPD
    1CNN-10.860.792.620.850.862.540.616.371.61
    CNN-20.890.702.980.880.742.930.705.601.83
    2CNN-30.920.593.510.900.683.210.734.812.13
    CNN-40.930.533.840.940.514.050.785.341.92
    Table 5. The prediction performance of four models on different datasets(unit of RMSE: g·kg-1)
    Rong-hua JI, Ying-ying ZHAO, Min-zan LI, Li-hua ZHENG. Research on Prediction Model of Soil Nitrogen Content Based on Encoder-CNN[J]. Spectroscopy and Spectral Analysis, 2022, 42(5): 1372
    Download Citation