
Xiaoting Deng, Nan Gao, Zonghua Zhang. Calibration of System Parameters Based on Direct Phase Measuring Deflectometry[J]. Laser & Optoelectronics Progress, 2018, 55(6): 061204
- Laser & Optoelectronics Progress
- Vol. 55, Issue 6, 061204 (2018)
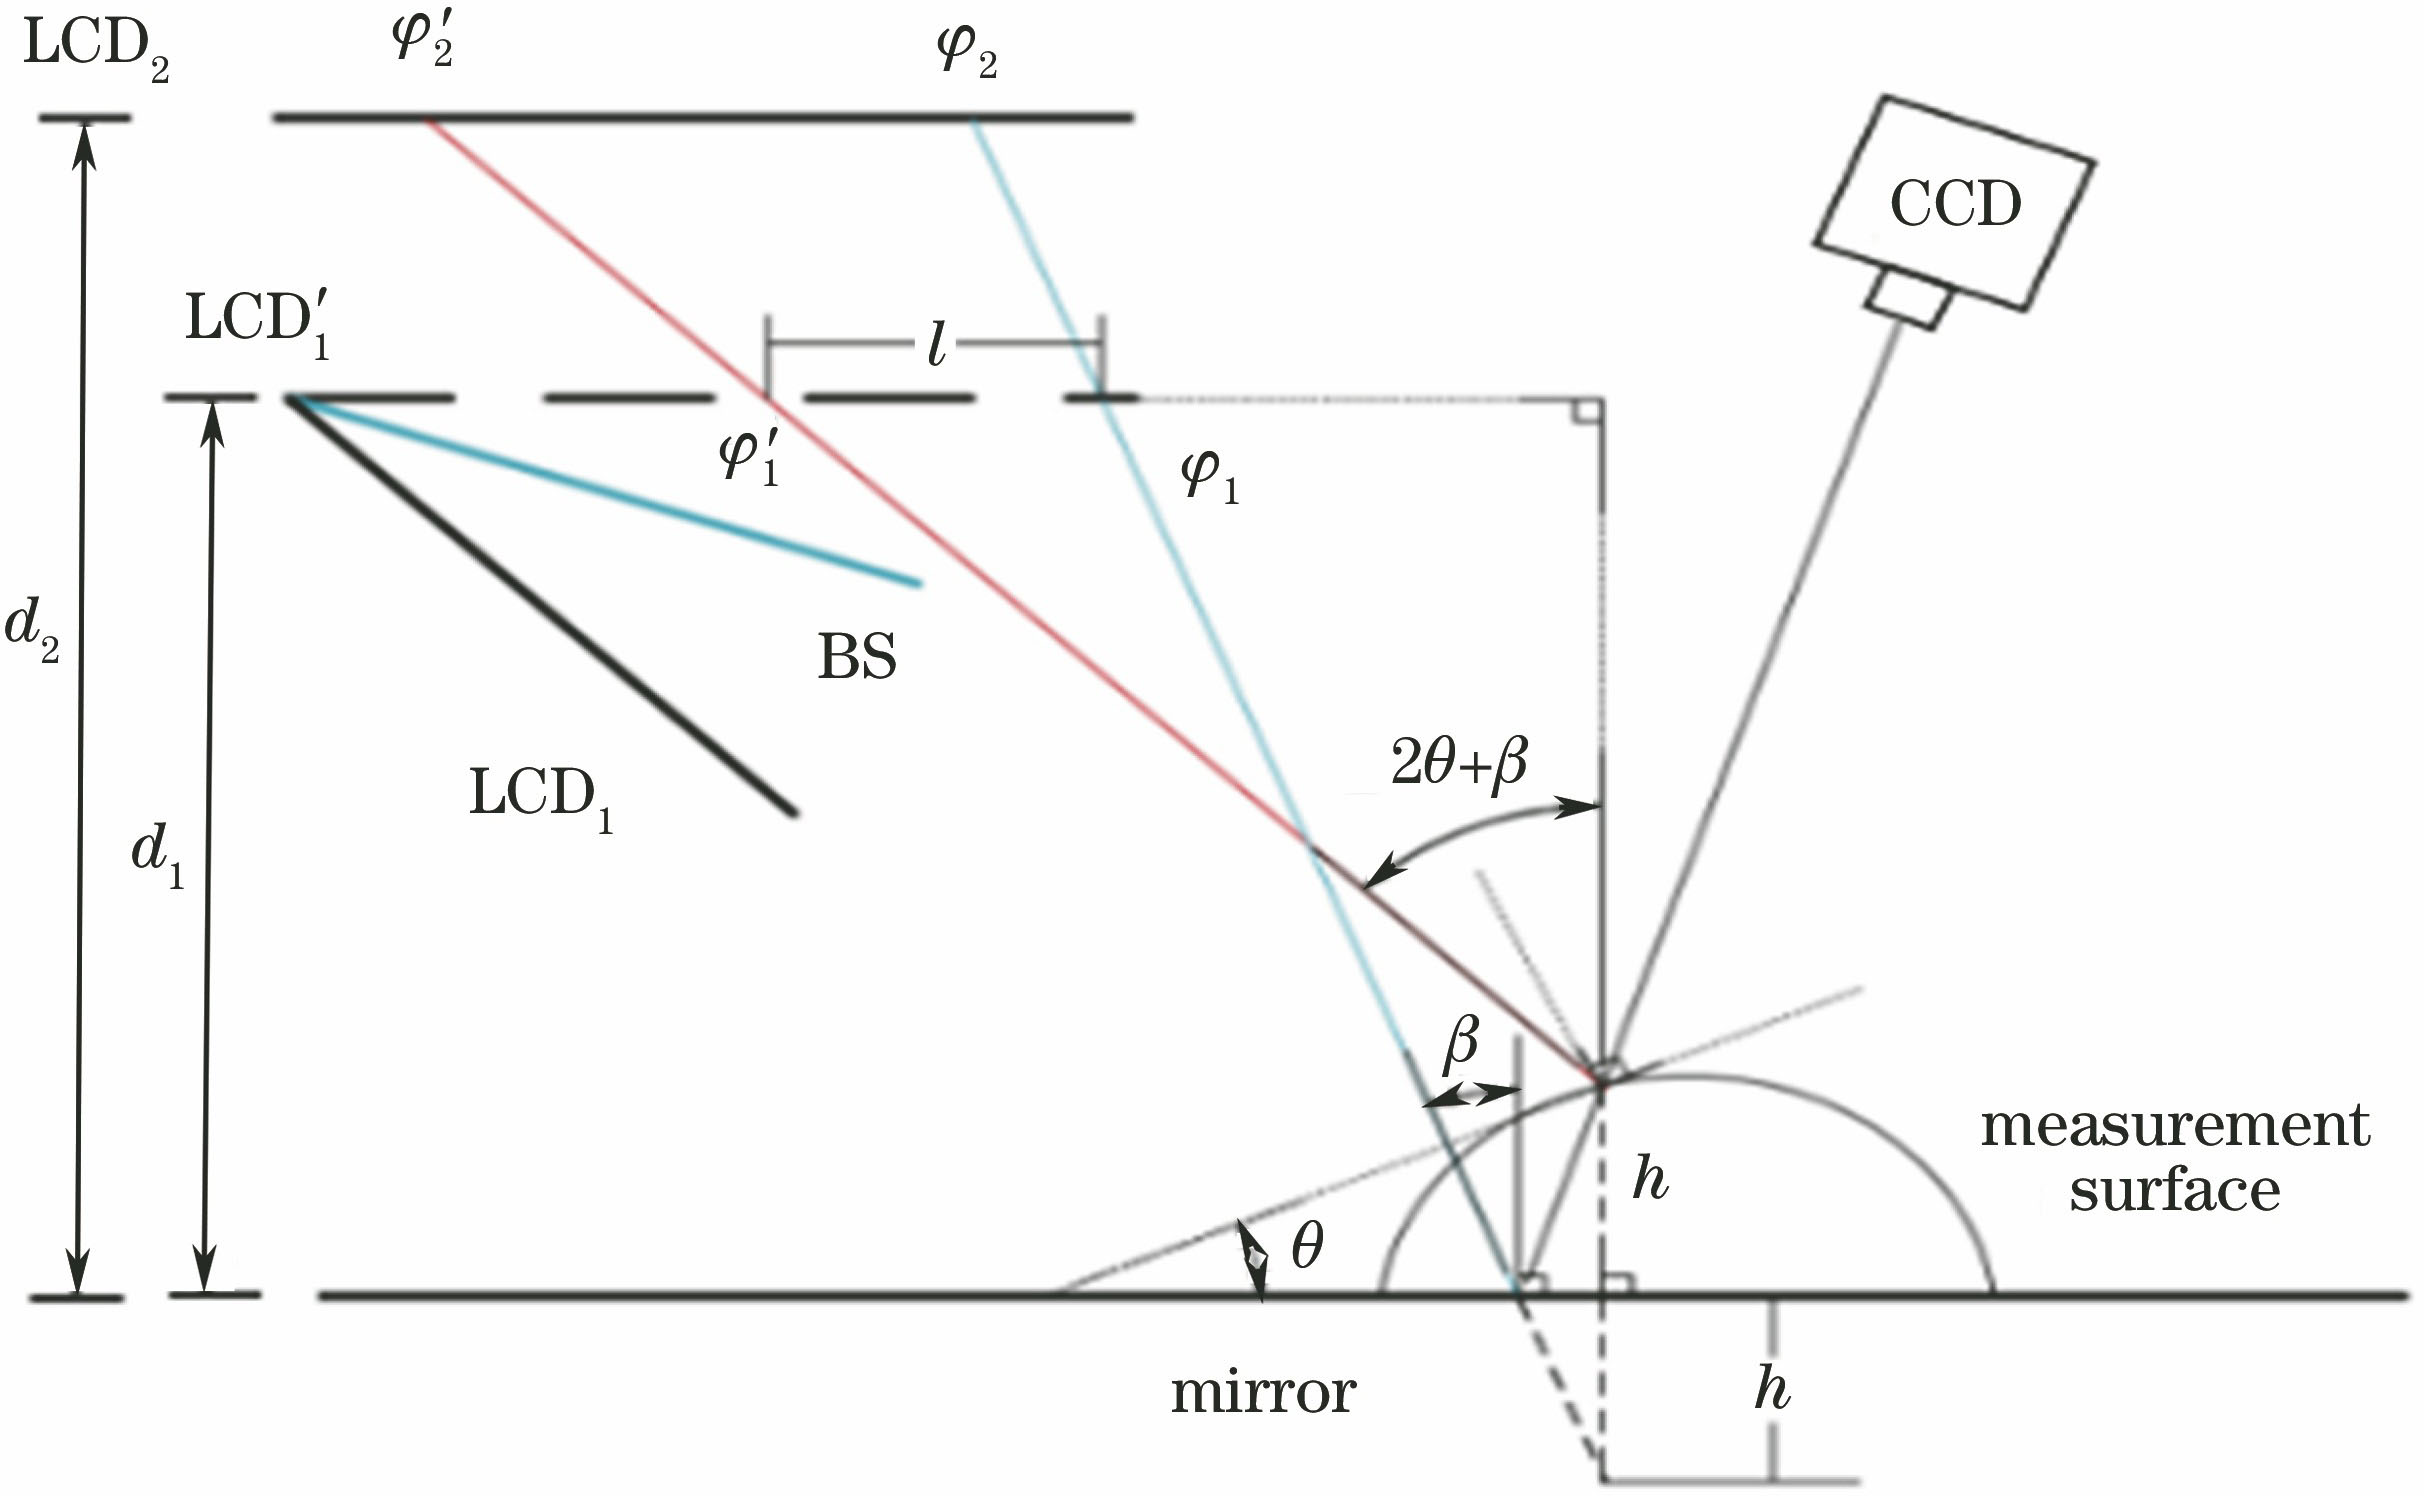
Fig. 1. Schematic of the measuring system
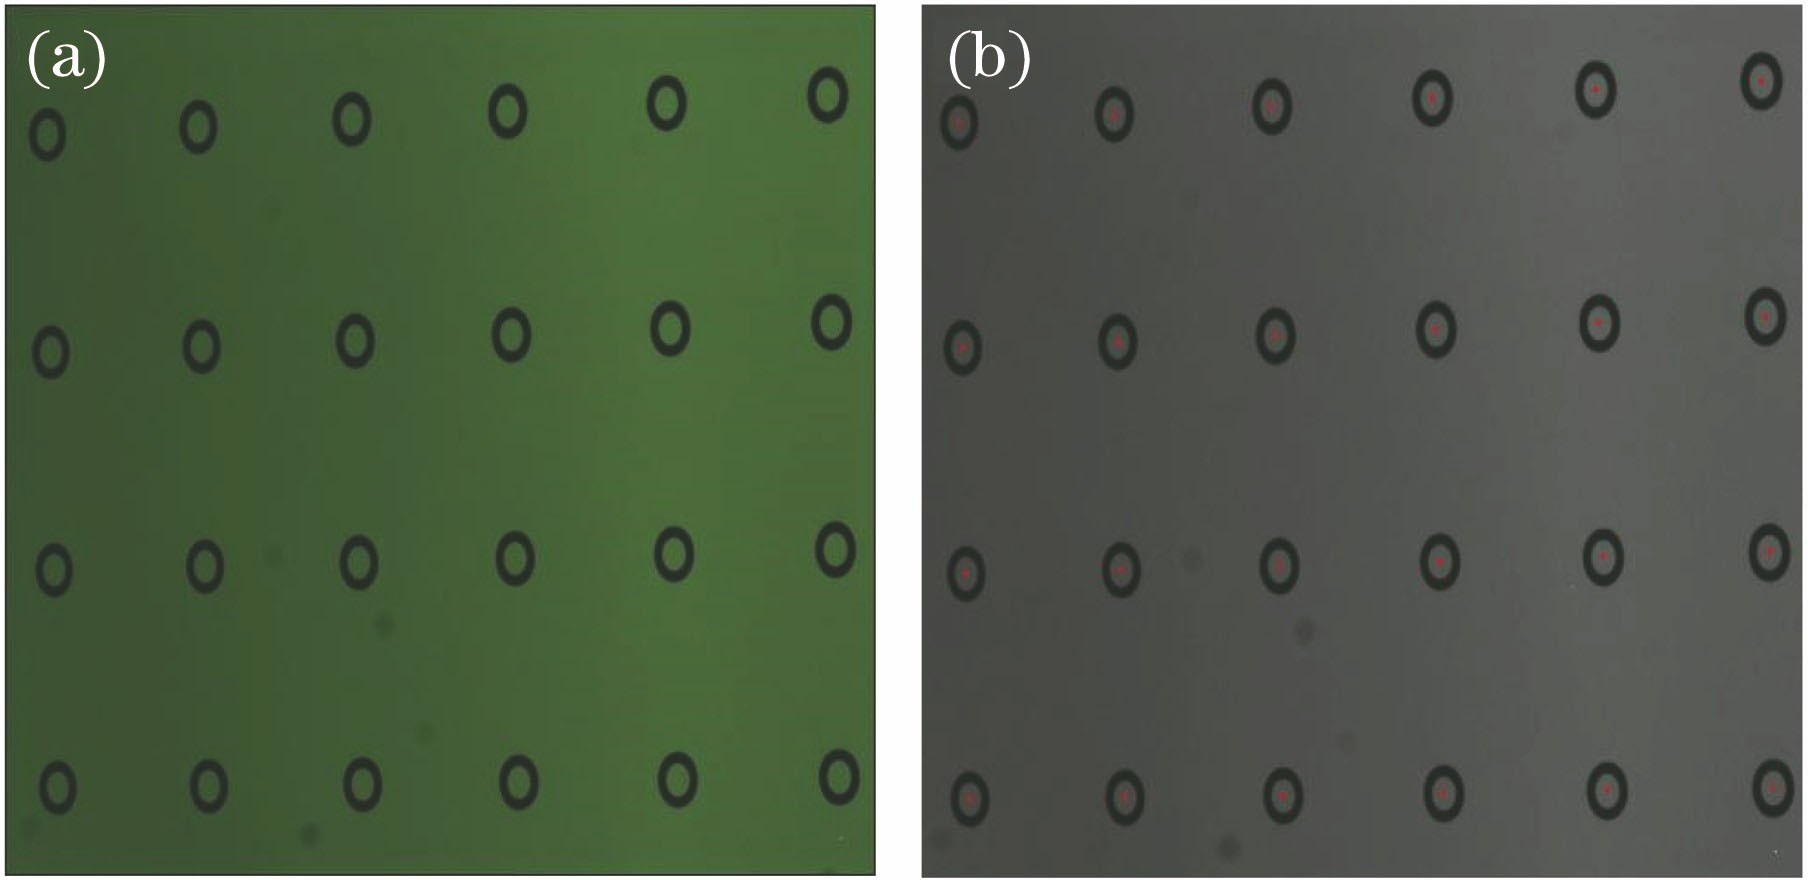
Fig. 2. Images of hollow ring marker matrix captured by the camera. (a) Texture image; (b) red dots representing the center of each hollow ring marker
Fig. 3. Fringe patterns displayed on the screen. (a) Horizontal fringe; (b) vertical fringe
Fig. 4. Feature points matching using absolute phase image
Fig. 5. Calibration of parameters d1 and d2
Fig. 6. Experimental system
Fig. 7. Reprojection error of the calibrated camera (pixel)
Fig. 8. Error of the calibrated extrinsic parameters
Fig. 9. Photos of (a) concave mirror and (b) manufactured artificial step
Fig. 10. Measured 3D shapes. (a) Concave mirror; (b) artificial specular step
| ||||||||||||||||||||||||
Table 1. Calibrated internal parameters of the camera
|
Table 2. Results of LCD's extrinsic parameters using checkerboard and fringe patternsmm
|
Table 3. True and measured distances of the artificial specular step and their errorsmm

Set citation alerts for the article
Please enter your email address
© Copyright 2018-2021 | Chinese Laser Press. All Rights Reserved 沪ICP备15018463号-20