• Acta Optica Sinica
  • Vol. 37, Issue 10, 1001002 (2017)
Zongqun Yan1、*, Zhihong Xie1, Jian Chen2, Jianchang Yang1, and Jinghua Chen3
Author Affiliations
  • 1 Department of Control Engineering, Academy of Armored Forces Engineering, Beijing 100072, China
  • 2 Army 66011 of PLA, Beijing 102600, China
  • 3 Army 66061 of PLA, Beijing 100144, China
  • show less
    DOI: 10.3788/AOS201737.1001002 Cite this Article Set citation alerts
    Zongqun Yan, Zhihong Xie, Jian Chen, Jianchang Yang, Jinghua Chen. Parametric Analysis of Spectral Channels in Monocular Multispectral Passive Ranging System Based on Oxygen Absorption[J]. Acta Optica Sinica, 2017, 37(10): 1001002 Copy Citation Text show less
    Corrected atmospheric total spectrum curve of oxygen A absorption band
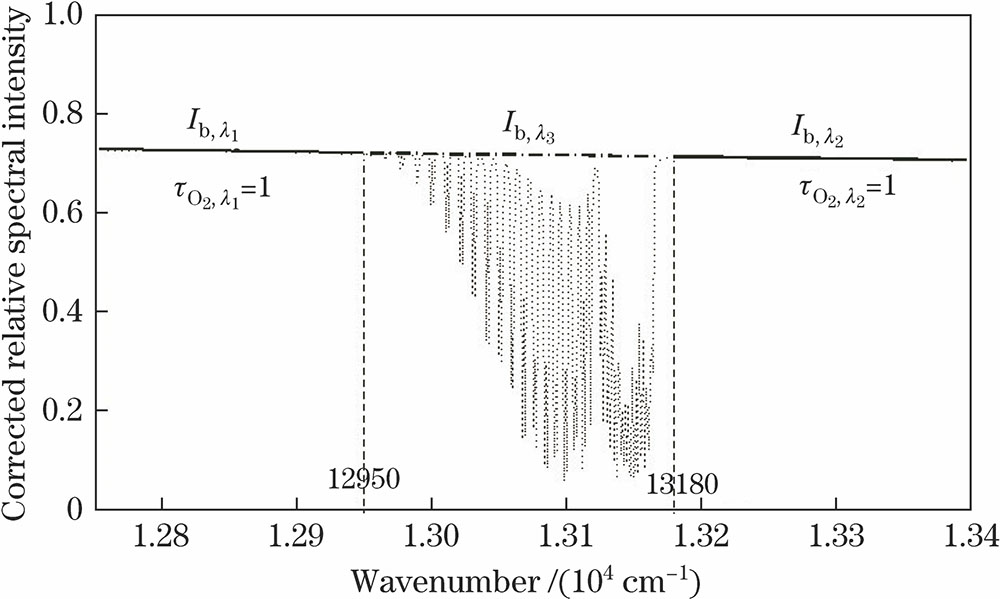
    Fig. 1. Corrected atmospheric total spectrum curve of oxygen A absorption band
    Schematic of monocular multispectral system with three spectral channels for ranging
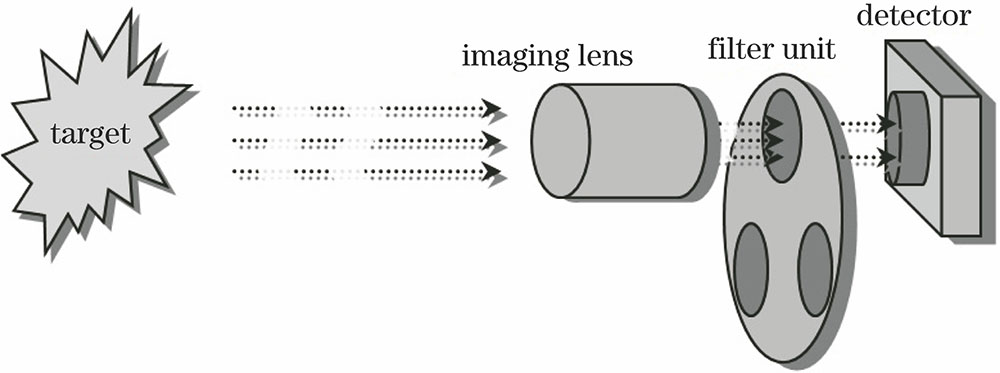
    Fig. 2. Schematic of monocular multispectral system with three spectral channels for ranging
    Ideal baseline and spectral intensity curve of target radiation after atmosphere attenuation
    Fig. 3. Ideal baseline and spectral intensity curve of target radiation after atmosphere attenuation
    Distributions of (a) sum of error squares and (b) R2 of non-absorbing baseline by linear fitting when N=1
    Fig. 4. Distributions of (a) sum of error squares and (b) R2 of non-absorbing baseline by linear fitting when N=1
    Deviation distribution of sum of error squares of non-absorbing baseline by different polynomial fittings when N=2. (a) Linear fitting (mean: 83.9008, variance: 0.0889, R2: 0.9998); (b) quadratic polynomial fitting (mean: 82.6881, variance: 8.8413×10⁻⁴, R2: 1); (c) cubic polynomial fitting (mean: 82.6742, variance: 1.2449×10⁻⁷, R2: 1)
    Fig. 5. Deviation distribution of sum of error squares of non-absorbing baseline by different polynomial fittings when N=2. (a) Linear fitting (mean: 83.9008, variance: 0.0889, R2: 0.9998); (b) quadratic polynomial fitting (mean: 82.6881, variance: 8.8413×10⁻⁴, R2: 1); (c) cubic polynomial fitting (mean: 82.6742, variance: 1.2449×10⁻⁷, R2: 1)
    Non-absorbing baseline by linear fitting and position of different fitting data points
    Fig. 6. Non-absorbing baseline by linear fitting and position of different fitting data points
    Difference of absorption coefficients in the oxygen A absorption band
    Fig. 7. Difference of absorption coefficients in the oxygen A absorption band
    Variation in (a) absorptivity and (b) slope of absorptivity with path length
    Fig. 8. Variation in (a) absorptivity and (b) slope of absorptivity with path length
    Ideal baseline and spectral intensity curve of target radiation after atmospheric attenuation
    Fig. 9. Ideal baseline and spectral intensity curve of target radiation after atmospheric attenuation
    Distribution of sum of error squares of non-absorbing baseline by linear fitting when N=2
    Fig. 10. Distribution of sum of error squares of non-absorbing baseline by linear fitting when N=2
    NLinear polynomialQuadratic polynomialCubic polynomialQuartic polynomialQuintic polynomial
    147.959
    248.35547.81847.658
    348.41747.43947.62746.56251.167
    448.33247.57047.96246.20147.367
    548.34147.83547.29447.95448.458
    All data points48.50447.79147.78947.78847.677
    Table 1. Sum of error squares between ideal baseline and non-absorbing baselines by different fitting polynomials with different fitting data
    NLinear polynomialQuadratic polynomialCubic polynomialQuartic polynomialQuintic polynomial
    10.2215
    20.22470.22030.2215
    30.22510.21710.21920.21760.2463
    40.22440.21820.22180.20660.2171
    50.22450.22040.21630.22130.2253
    All data points0.22570.22000.22030.22010.2192
    Table 2. Absorptivity of oxygen A band with non-absorbing baseline by different fitting polynomials with different fitting data
    NSum of error squares/variance
    Linear polynomialQuadratic polynomialCubic polynomialQuartic polynomial
    239.4996/0.0954
    339.5432/0.056939.9073/0.0224
    439.5629/0.038439.9112/0.004839.8993/0.0325
    539.5747/0.026839.9105/0.004339.9001/0.029339.8674/0.1570
    All data points39.5997/039.8934/039.8523/039.7667/0
    Table 3. Variance and sum of error squares between non-absorbing baseline and ideal baseline
    Zongqun Yan, Zhihong Xie, Jian Chen, Jianchang Yang, Jinghua Chen. Parametric Analysis of Spectral Channels in Monocular Multispectral Passive Ranging System Based on Oxygen Absorption[J]. Acta Optica Sinica, 2017, 37(10): 1001002
    Download Citation