
Yan-yan LI, Hai-jun LUO, Xia LUO, Xin-yan FAN, Rui QIN. Detection of Craniocerebral Hematoma by Array Scanning Sensitivity Based on Near Infrared Spectroscopy[J]. Spectroscopy and Spectral Analysis, 2022, 42(2): 392
- Spectroscopy and Spectral Analysis
- Vol. 42, Issue 2, 392 (2022)
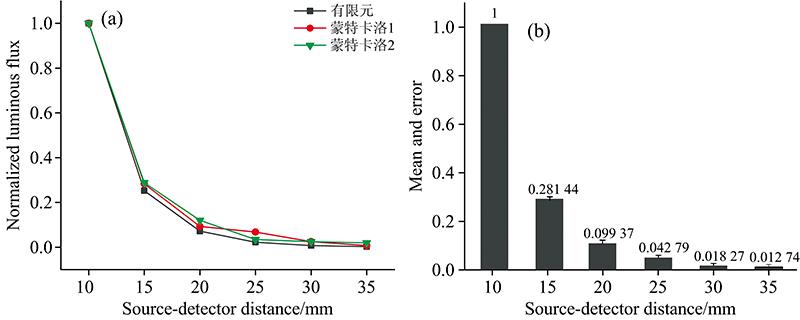
Fig. 1. The simulation data and average ratio of finite element and Monte Carlo methods
(a): Simulation comparison between finite element and Monte Carlo methods;(b): The average detection ratio and error of the simulation results
(a): Simulation comparison between finite element and Monte Carlo methods;(b): The average detection ratio and error of the simulation results
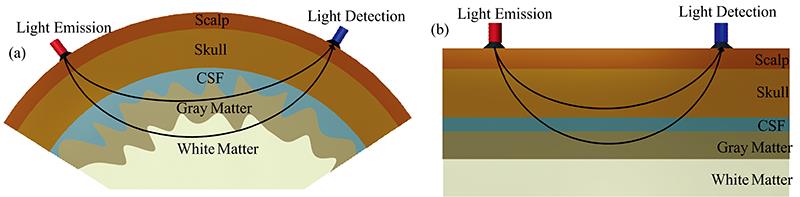
Fig. 2. Models of brain tissue
(a): Normal model; (b): Simplified model
(a): Normal model; (b): Simplified model
Fig. 3. Single-source multi-detectors array
Fig. 4. Simulated photons travel through brain tissue
(a): Diagram of simulation (normal brain tissue); (b): Distribution of light flux in different layers of brain tissue (normal brain tissue); (c): Diagram of simulation (brain tissue containing hematoma); (d): Distribution of light flux in different layers of brain tissue (brain tissue containing hematoma)
(a): Diagram of simulation (normal brain tissue); (b): Distribution of light flux in different layers of brain tissue (normal brain tissue); (c): Diagram of simulation (brain tissue containing hematoma); (d): Distribution of light flux in different layers of brain tissue (brain tissue containing hematoma)
Fig. 5. The location of the hematoma and detection sensitivity curves of partial azimuth arrays
(a): Hematoma located at 0°; (b): Sensitivity curves of the hematoma at 0°; (c): Hematoma located at 30°; (d): Sensitivity curves of the hematoma at 30°; (e): Hematoma located at 60°; (f): Sensitivity curves of the hematoma at 60°
Note:d is the source-detector distance
(a): Hematoma located at 0°; (b): Sensitivity curves of the hematoma at 0°; (c): Hematoma located at 30°; (d): Sensitivity curves of the hematoma at 30°; (e): Hematoma located at 60°; (f): Sensitivity curves of the hematoma at 60°
Note:
Fig. 6. Sensitivity curves of hematoma at different horizontal locations
(a): Horizontal position of the hematoma; (b): Sensitivity curves at different horizontal positions;(c): Peak sensitivities at different detection points
(a): Horizontal position of the hematoma; (b): Sensitivity curves at different horizontal positions;(c): Peak sensitivities at different detection points
Fig. 7. Sensitivity curves of hematomas at different depths
(a): The depth of the hematoma; (b): Sensitivity curves
Note: The white area inFig.7 (a) indicates a hematoma
(a): The depth of the hematoma; (b): Sensitivity curves
Note: The white area in
|
Table 1. Optical parameters of the head model at 850 nm

Set citation alerts for the article
Please enter your email address
© Copyright 2018-2021 | Chinese Laser Press. All Rights Reserved 沪ICP备15018463号-20