
Guangmin Zeng, Jie Peng, Pinghua Tang. Numerical Investigation on Self-Similar Mode-Locked Er-Doped Fluoride Fiber Laser at 2.8 μm[J]. Laser & Optoelectronics Progress, 2022, 59(13): 1314004
- Laser & Optoelectronics Progress
- Vol. 59, Issue 13, 1314004 (2022)
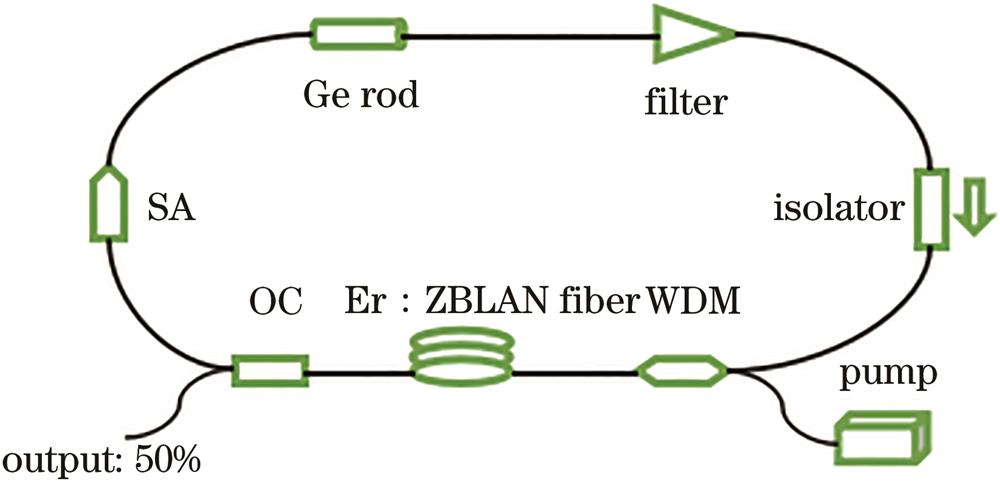
Fig. 1. Schematic diagram of self-similar mode-locked Er-doped fluoride fiber laser at 2.8 μm
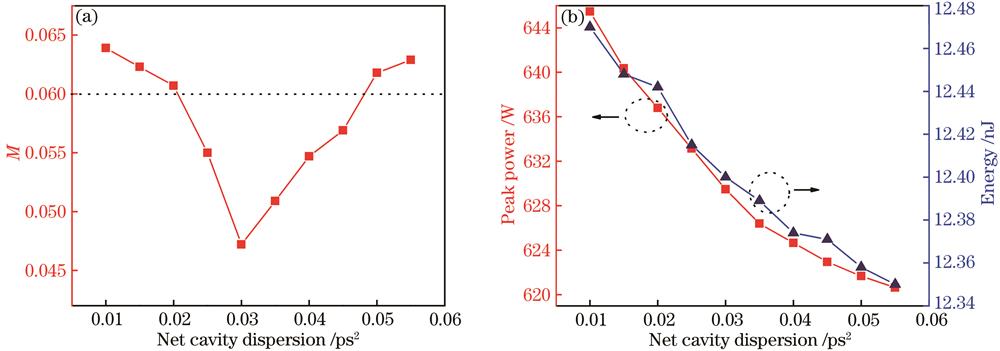
Fig. 2. Effect of net cavity dispersion on output pulse. (a) Relationship between net cavity dispersion and M; (b) effect of net cavity dispersion on peak power and pulse energy
Fig. 3. Evolution of output pulse and spectrum with round trips. (a) Evolution of the pulse; (b) evolution of the spectrum
Fig. 4. Output pulses at 300 cycles. (a) Pulse time domain graph; (b) pulse frequency domain graph
Fig. 5. Evolution of pulse width and spectral width in the cavity
Fig. 6. Effect of small-signal gain on the output pulse. (a) Effect of small-signal gain on peak power and pulse width; (b) effect of small-signal gain on 3 dB spectral bandwidth and pulse energy
Fig. 7. Effect of saturation on the output pulse. (a) Effect of saturation energy on peak power and pulse width; (b) effect of saturation energy
Fig. 8. Effect of modulation on the output pulse. (a) Effect of modulation depth on peak power and pulse width; (b) effect of modulation depth on 3 dB spectral bandwidth and pulse energy
Fig. 9. Effect of SA’s saturation power on the output pulse. (a) Effect of SA’s saturation poweron peak power and pulse width; (b) effect of SA’s saturation power on 3 dB spectral bandwidth and pulse energy
|
Table 1. Simulation parameters of the laser

Set citation alerts for the article
Please enter your email address
© Copyright 2018-2021 | Chinese Laser Press. All Rights Reserved 沪ICP备15018463号-20