
Liqun Cui, Qingjie He, Muze He. Manifold Regular Correlation Filter Tracking Algorithm Based on Dual-Core Model Context[J]. Laser & Optoelectronics Progress, 2021, 58(12): 1210011
- Laser & Optoelectronics Progress
- Vol. 58, Issue 12, 1210011 (2021)
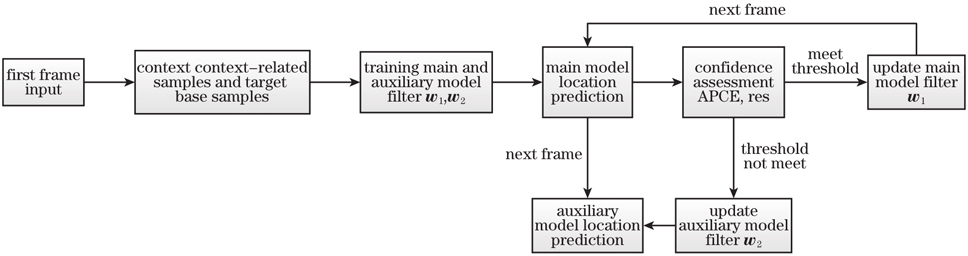
Fig. 1. Flow chart of our algorithm
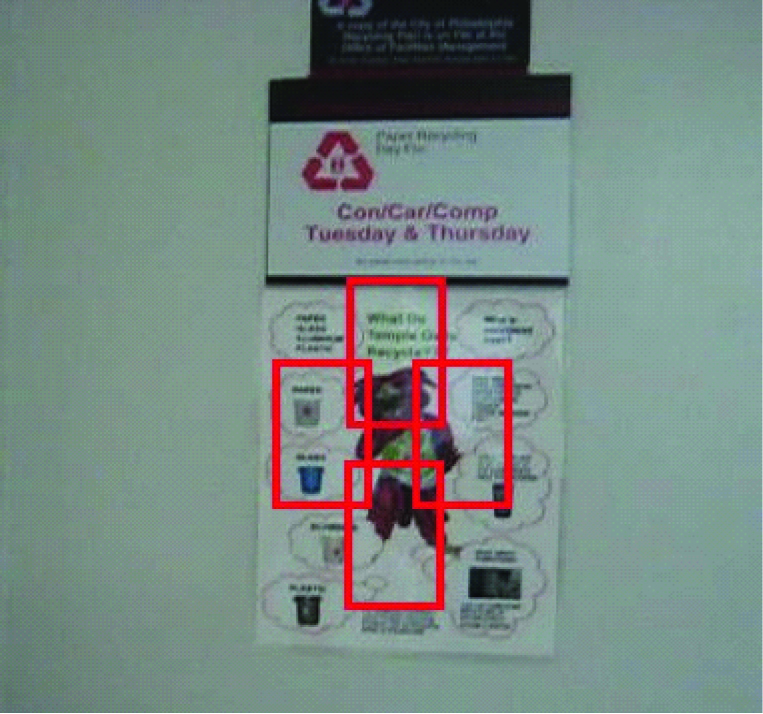
Fig. 2. Schematic diagram of the context overlap sampling
Fig. 3. Tracking instance and its corresponding response graph. (a) Normal tracking; (b) occlusion occurs; (c) response graph when normal tracking; (d) response graph when occlusion occurs
Fig. 4. Comparison and verification of auxiliary module and feature selection. (a) DP; (b) OPE
Fig. 5. Tracking results of different algorithms on the OTB2015 data set. (a) DP; (b) OPE
Fig. 6. OPE of different algorithms in different scenarios. (a) BC; (b) DEF; (c) OCC; (d) SV; (e) OPR; (f) OV
Fig. 7. Tracking results of different algorithms on 6 video sequences. (a) Biker; (b) Bird1; (c) ClifBar; (d) Ironman; (e) Soccer; (f) Swinning
|
Table 1. Initialization parameters of the main module
|
Table 2. Initialization parameters of auxiliary module
|
Table 3. Results of the tuning experiment
|
Table 4. Independence verification results of modules
|
Table 5. Comparison between our algorithm and the tracking algorithms with better real-time performance
|
Table 6. Comparison between our algorithm and the algorithms based on deep convolutional neural network
|
Table 7. Tracking effects of different algorithms on the VOT2016 data set

Set citation alerts for the article
Please enter your email address
© Copyright 2018-2021 | Chinese Laser Press. All Rights Reserved 沪ICP备15018463号-20