• Advanced Photonics Nexus
  • Vol. 3, Issue 2, 026007 (2024)
Run Sun1, Tingzhao Fu2、*, Yuyao Huang1, Wencan Liu1, Zhenmin Du1, and Hongwei Chen1、*
Author Affiliations
  • 1Tsinghua University, Beijing National Research Center for Information Science and Technology, Department of Electronic Engineering, Beijing, China
  • 2National University of Defense Technology, College of Advanced Interdisciplinary Studies, Hunan Provincial Key Laboratory of Novel Nano-Optoelectronic Information Materials and Devices, Changsha, China
  • show less
    DOI: 10.1117/1.APN.3.2.026007 Cite this Article Set citation alerts
    Run Sun, Tingzhao Fu, Yuyao Huang, Wencan Liu, Zhenmin Du, Hongwei Chen. Multimode diffractive optical neural network[J]. Advanced Photonics Nexus, 2024, 3(2): 026007 Copy Citation Text show less
    Multimode DONN and EAM. (a) Multimode DONN. As an example, the width of the multimode waveguide is 6 μm. There are 19 eigenmodes in the lateral direction. (b) The details of the metaline. The length and width of the Si etching slot are 1.1 and 0.2 μm, respectively. There are 12 positions for the Si etching slot to be placed with a lateral period of 0.5 μm, which is filled with silica. As shown in (c)–(f), the coupling between the eigenmodes physically enables the network connection. (c) Input structure. Each input fundamental mode field excites the response separately, which is decomposed into the 19 eigenmodes. (d) The 19 eigenmodes propagate independently, and the 19 responses are excited after passing through the metaline. The responses are decomposed into the 19 eigenmodes again. (e) The output structure of the multiplexing space. The 19 eigenmodes excite the 19 responses, then part of the energy in the responses is coupled to the three output waveguides, and the rest leaks out. (f) The output structure of the joint multiplexing space and mode with a total of four output ports.
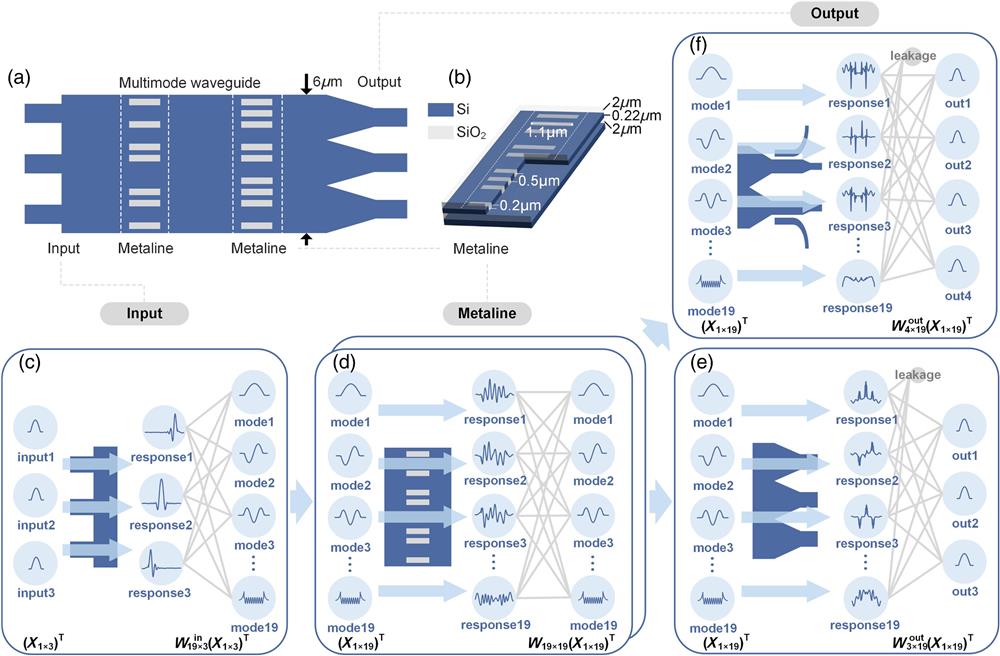
    Fig. 1. Multimode DONN and EAM. (a) Multimode DONN. As an example, the width of the multimode waveguide is 6  μm. There are 19 eigenmodes in the lateral direction. (b) The details of the metaline. The length and width of the Si etching slot are 1.1 and 0.2  μm, respectively. There are 12 positions for the Si etching slot to be placed with a lateral period of 0.5  μm, which is filled with silica. As shown in (c)–(f), the coupling between the eigenmodes physically enables the network connection. (c) Input structure. Each input fundamental mode field excites the response separately, which is decomposed into the 19 eigenmodes. (d) The 19 eigenmodes propagate independently, and the 19 responses are excited after passing through the metaline. The responses are decomposed into the 19 eigenmodes again. (e) The output structure of the multiplexing space. The 19 eigenmodes excite the 19 responses, then part of the energy in the responses is coupled to the three output waveguides, and the rest leaks out. (f) The output structure of the joint multiplexing space and mode with a total of four output ports.
    Training process and application demonstration of the multimode DONN composed of the structures in the library. When the task is defined, the training data are loaded into a variety of the potential multimode DONN structures composed of the input, output, and metalines in the library, as shown by the dotted lines. The performance of each potential multimode DONN is evaluated using the port-to-port transmission matrix and the best one is selected. Live or test data will be loaded in.
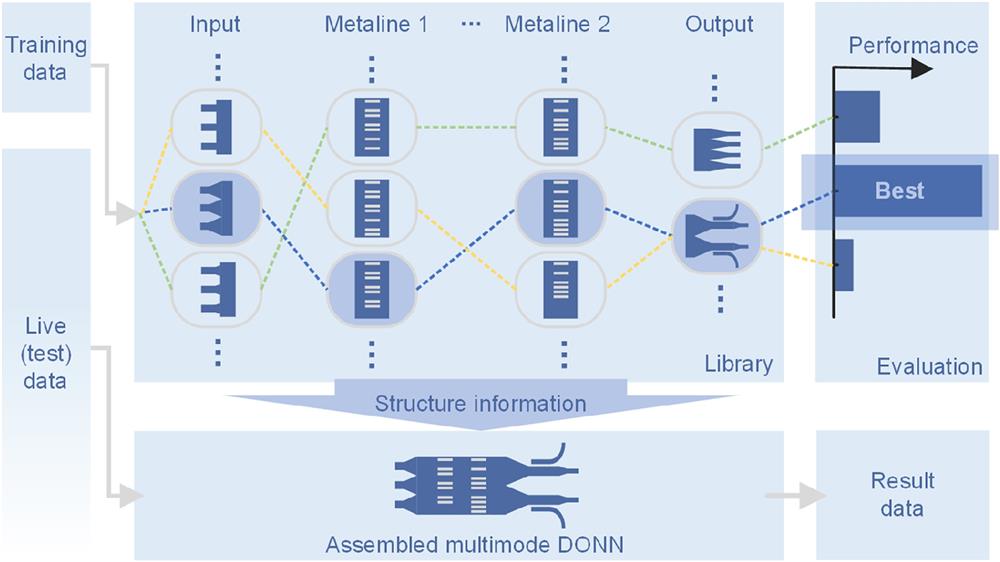
    Fig. 2. Training process and application demonstration of the multimode DONN composed of the structures in the library. When the task is defined, the training data are loaded into a variety of the potential multimode DONN structures composed of the input, output, and metalines in the library, as shown by the dotted lines. The performance of each potential multimode DONN is evaluated using the port-to-port transmission matrix and the best one is selected. Live or test data will be loaded in.
    The classification task of the Iris plants dataset. (a) Multimode DONN structure. The category corresponding to the output port receiving the highest power is judged as a classification result. PD, photodetector. (b) A set of Setosa class data is simulated by var-FDTD. (c) The confusion matrix of the test dataset. (d) Fundamental mode amplitudes for the three output ports of the test dataset. The gray and yellow bars mark the dataset presented in (b) and the three misclassified datasets, respectively.
    Fig. 3. The classification task of the Iris plants dataset. (a) Multimode DONN structure. The category corresponding to the output port receiving the highest power is judged as a classification result. PD, photodetector. (b) A set of Setosa class data is simulated by var-FDTD. (c) The confusion matrix of the test dataset. (d) Fundamental mode amplitudes for the three output ports of the test dataset. The gray and yellow bars mark the dataset presented in (b) and the three misclassified datasets, respectively.
    One-bit binary adder. (a) Multimode DONN and discriminant structure. (b) Var-FDTD simulation of four input cases. (c) The power of the four output ports normalized to the input port power. Ports 1 to 4 indicate the marked ports, as shown by the dashed gray lines.
    Fig. 4. One-bit binary adder. (a) Multimode DONN and discriminant structure. (b) Var-FDTD simulation of four input cases. (c) The power of the four output ports normalized to the input port power. Ports 1 to 4 indicate the marked ports, as shown by the dashed gray lines.
    Previous DONN layout. (a) Every three identical Si etching slots form a group in the metaline, which is laid in a lateral open Si slab. wpq represents the diffractive connection between the points p and q, which are placed in the adjacent metalines. (b) Phase shift or transmittance versus the length of the group, except for the length of the group, and the parameters of the Si etching slot are consistent with Fig. 1(b) (more details in Appendix A).
    Fig. 5. Previous DONN layout. (a) Every three identical Si etching slots form a group in the metaline, which is laid in a lateral open Si slab. wpq represents the diffractive connection between the points p and q, which are placed in the adjacent metalines. (b) Phase shift or transmittance versus the length of the group, except for the length of the group, and the parameters of the Si etching slot are consistent with Fig. 1(b) (more details in Appendix A).
    The optical fields calculated by the DAM and EAM are compared. (a) The amplitude of the optical field in the lateral open device obtained by var-FDTD. (b) RMSE of DAM or EAM varies with the propagation distance. The gray narrow strip areas are the metalines. (c) The amplitude of the optical field in the multimode device is obtained by var-FDTD simulation. (d)–(i) Comparison of the optical fields calculated by the DAM (EAM) or var-FDTD in front of the first and second metalines, and at the end.
    Fig. 6. The optical fields calculated by the DAM and EAM are compared. (a) The amplitude of the optical field in the lateral open device obtained by var-FDTD. (b) RMSE of DAM or EAM varies with the propagation distance. The gray narrow strip areas are the metalines. (c) The amplitude of the optical field in the multimode device is obtained by var-FDTD simulation. (d)–(i) Comparison of the optical fields calculated by the DAM (EAM) or var-FDTD in front of the first and second metalines, and at the end.
    Average and variance of mode coupling matrices categorized by the number of Si etching slots. The 4096 metalines obtained in Sec. 3.1 of the main text are classified based on the number of etching slots, ranging from 0 to 12. The quantity of the metalines in each group is listed above the images. The top image in each group displays the average amplitude of the elements in the mode coupling matrices, while the bottom image shows the variance. The numbers in the horizontal direction are the input mode numbers, and the numbers in the vertical direction are the output mode numbers.
    Fig. 7. Average and variance of mode coupling matrices categorized by the number of Si etching slots. The 4096 metalines obtained in Sec. 3.1 of the main text are classified based on the number of etching slots, ranging from 0 to 12. The quantity of the metalines in each group is listed above the images. The top image in each group displays the average amplitude of the elements in the mode coupling matrices, while the bottom image shows the variance. The numbers in the horizontal direction are the input mode numbers, and the numbers in the vertical direction are the output mode numbers.
    InputBIASOutput
    IN-1IN-2OUT-1OUT-2
    00100
    01101
    10101
    11110
    Table 1. The truth table of a one-bit binary adder.
    WorksDesign methodFootprint (μm2)Number of input × outputTypical loss (dB)
    Ref. 11DAM1000×2804×3−14.55
    Ref. 28DAM1200×759×2−22.01
    Ref. 33DAM and fitting network30×504×3−8.86
    Ref. 27Particle swarm search45×304×3−13.01
    This workEAM and library15×104×3−7.69
    Table 2. Comparison with previous works.
    Run Sun, Tingzhao Fu, Yuyao Huang, Wencan Liu, Zhenmin Du, Hongwei Chen. Multimode diffractive optical neural network[J]. Advanced Photonics Nexus, 2024, 3(2): 026007
    Download Citation