• Spectroscopy and Spectral Analysis
  • Vol. 41, Issue 7, 2005 (2021)
Jing-zhu WU1、*, Xiao-qi LI1、1;, Li-juan SUN2、2;, Cui-ling LIU1、1;, Xiao-rong SUN1、1;, Mei SUN1、1;, and Le YU1、1;
Author Affiliations
  • 11. Beijing Key Laboratory of Big Data Technology for Food Safety, Beijing Technology and Business University, Beijing 100048, China
  • 22. Institute of Crop Science, Chinese Academy of Agricultural Sciences, Beijing 100081, China
  • show less
    DOI: 10.3964/j.issn.1000-0593(2021)07-2005-07 Cite this Article
    Jing-zhu WU, Xiao-qi LI, Li-juan SUN, Cui-ling LIU, Xiao-rong SUN, Mei SUN, Le YU. Study on the Optimization Method of Maize Seed Moisture Quantification Model Based on THz-ATR Spectroscopy[J]. Spectroscopy and Spectral Analysis, 2021, 41(7): 2005 Copy Citation Text show less
    Time domain spectra and frequency domain spectra of the first batch of samples with different water contents(a): Time domain spectra;(b): Frequency domain spectra
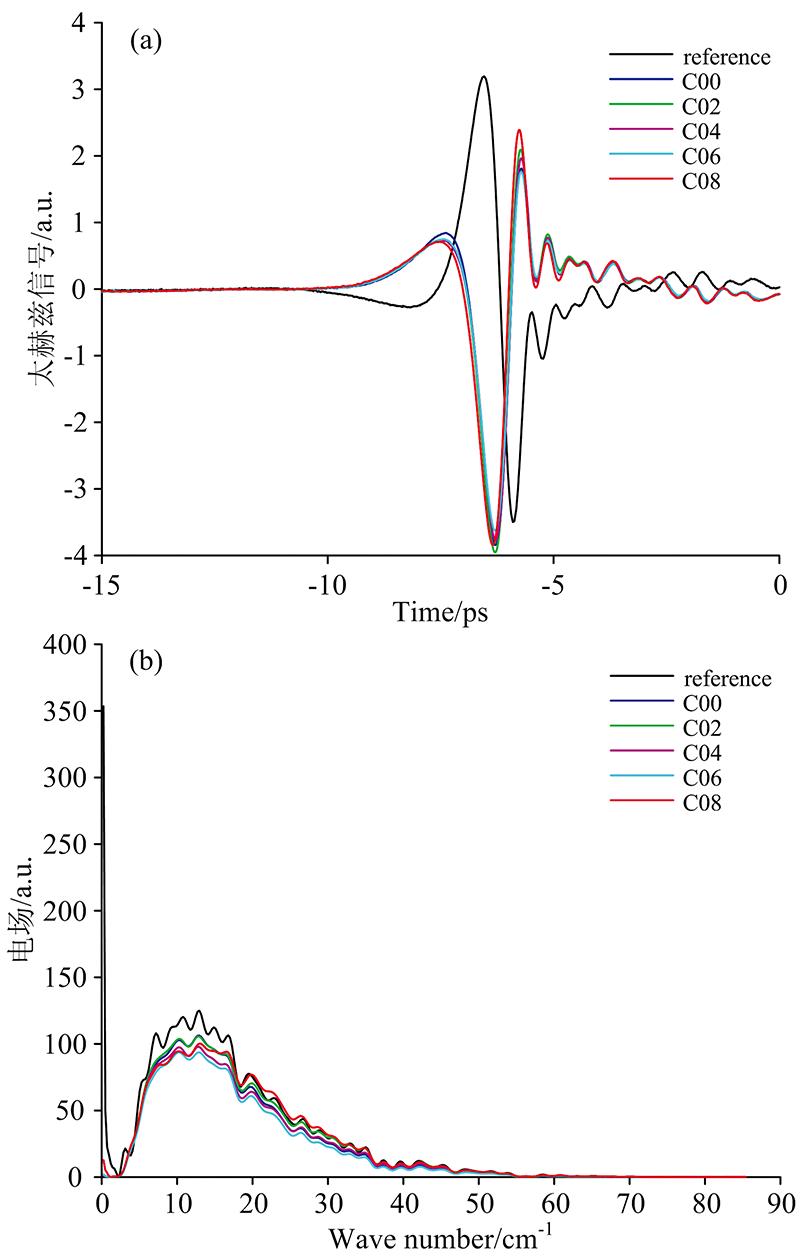
    Fig. 1. Time domain spectra and frequency domain spectra of the first batch of samples with different water contents
    (a): Time domain spectra;(b): Frequency domain spectra
    Absorbance spectra of the first batch of samples with different water content
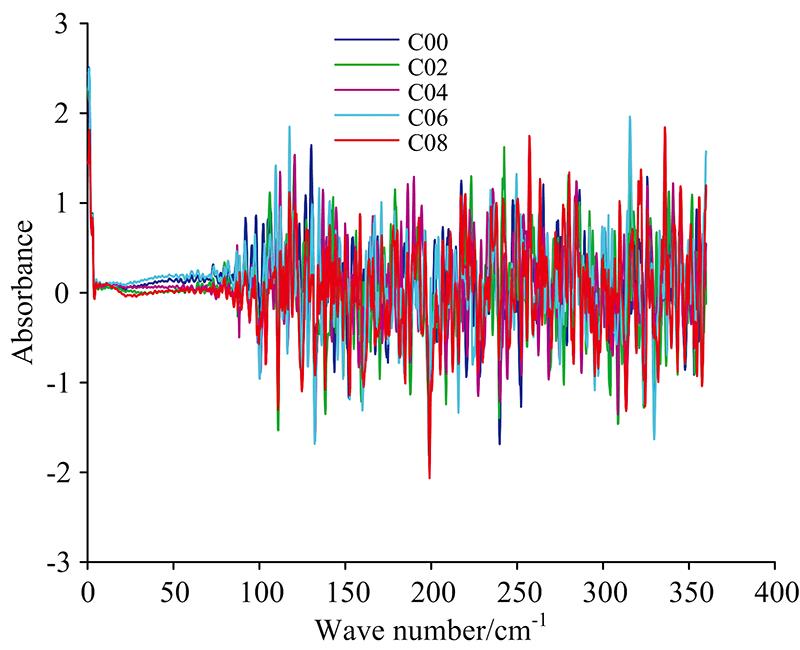
    Fig. 2. Absorbance spectra of the first batch of samples with different water content
    THz characteristic spectral region of seed moisture based on interval PLSR(a): iPLS; (b): biPLS; (c): siPLS; (d): mwPLS
    Fig. 3. THz characteristic spectral region of seed moisture based on interval PLSR
    (a): iPLS; (b): biPLS; (c): siPLS; (d): mwPLS
    Quantitative model prediction results based on siPLS feature band SVR
    Fig. 4. Quantitative model prediction results based on siPLS feature band SVR
    样本
    容量
    最小值
    /%
    最大值
    /%
    平均值
    /%
    标准差极差
    /%
    变异
    系数/%
    409.5812.7111.040.823.137.42
    Table 1. Statistical information of moisture content of samples
    波数范围/cm-1变量个数预处理主成分数rRMSECRMSEPRPD
    1.2~359.941 502-100.863 40.002 20.703 81.298 8
    Smooth100.805 20.013 50.821 01.127 7
    MSC100.859 90.005 80.818 31.016 4
    SG100.844 10.004 00.740 91.252 7
    SNV100.864 40.003 80.713 31.221 9
    0.2~85.37357-40.996 50.158 60.209 94.239 8
    Smooth40.996 90.179 40.198 64.323 4
    MSC30.995 70.183 30.232 63.888 2
    SG40.995 40.151 80.239 33.829 9
    SNV20.995 90.201 20.226 33.866 7
    Table 2. Results of seed moisture PLSR model predictions
    方法主因
    子数
    rRMSECV特征波段/cm-1
    iPLS50.658 10.631 08.63~17.02
    biPLS100.662 90.606 90.2~3.11, 23.26~26.13
    siPLS90.762 00.526 25.75~11.27, 11.51~17.02,
    17.26~22.78, 51.79~57.31
    mwPLS50.644 90.585 411.75~18.94
    Table 3. Characteristic band screening results
    建模方法特征变量筛选变量个数主因子数rRMSECRMSEPRPD
    PLSRiPLS3630.996 50.202 00.209 84.088 9
    biPLS2720.995 70.215 40.234 23.861 3
    siPLS9630.995 60.215 60.234 13.675 5
    mwPLS3120.994 40.243 40.266 53.368 1
    Table 4. Prediction results of PLSR linear model based on feature intervals
    建模方法特征变量筛选变量个数cgrRMSECRMSEPRPD
    SVRiPLS36420.984 50.025 30.103 48.294 9
    biPLS2790.509 70.176 80.870 30.056 80.340 92.652 6
    siPLS962.828 40.353 60.993 00.021 20.069 712.345 7
    mwPLS31162.828 40.967 80.018 50.145 66.162 7
    Table 5. Prediction results of SVR nonlinear model based on characteristic intervals
    Jing-zhu WU, Xiao-qi LI, Li-juan SUN, Cui-ling LIU, Xiao-rong SUN, Mei SUN, Le YU. Study on the Optimization Method of Maize Seed Moisture Quantification Model Based on THz-ATR Spectroscopy[J]. Spectroscopy and Spectral Analysis, 2021, 41(7): 2005
    Download Citation