• Chinese Optics Letters
  • Vol. 17, Issue 6, 062401 (2019)
Chenchen Wu1、2, Ning Liu1、2, Hai Hu1、2, Xiangdong Guo1、2, Baoxin Liao1、2, Jiaming Liu2、3, Liming Wang4, Chunying Chen2、3, Xiaoxia Yang1、2、**, and Qing Dai1、2、*
Author Affiliations
  • 1Division of Nanophotonics, CAS Center for Excellence in Nanoscience, National Center for Nanoscience and Technology, Beijing 100190, China
  • 2Center of Materials Science and Optoelectronics Engineering, University of Chinese Academy of Sciences, Beijing 100049, China
  • 3CAS Key Laboratory for Biomedical Effects of Nanomaterials & Nanosafety, National Center for Nanoscience and Technology, Beijing 100190, China
  • 4Institute of High Energy Physics, Chinese Academy of Sciences, Beijing 100049, China
  • show less
    DOI: 10.3788/COL201917.062401 Cite this Article Set citation alerts
    Chenchen Wu, Ning Liu, Hai Hu, Xiangdong Guo, Baoxin Liao, Jiaming Liu, Liming Wang, Chunying Chen, Xiaoxia Yang, Qing Dai. Detecting molecular vibrational modes of side chains and endpoints in nanoscale proteins with graphene plasmon[J]. Chinese Optics Letters, 2019, 17(6): 062401 Copy Citation Text show less
    Graphene plasmon biosensor. (a) Schematic of the graphene plasmon sensor. Monolayer protein was deposited on top of the GNR array fabricated on 700 nm thick MgF2 supported on Si substrate. Incident IR light excites plasmon resonance across the GNR: S, source; D, drain. (b) SEM image of a GNR array with a ribbon width (W) of 100 nm and a period width (P) of 140 nm. (c) The electric transfer curve (green curve) and carrier density (red line) of the double layered graphene/MgF2 sensor. The black arrow is the CNP.
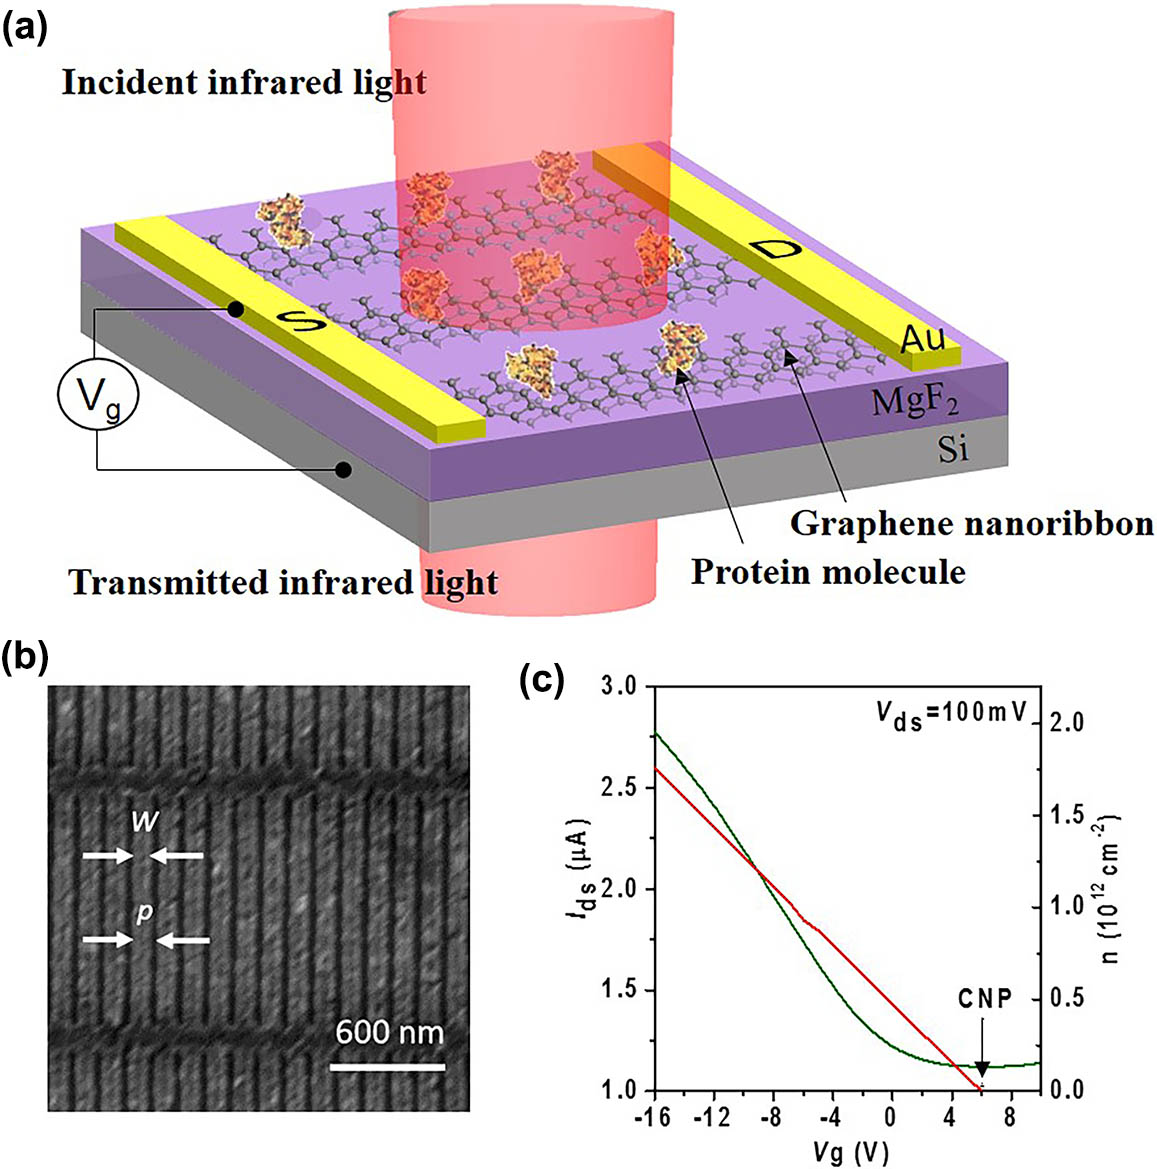
    Fig. 1. Graphene plasmon biosensor. (a) Schematic of the graphene plasmon sensor. Monolayer protein was deposited on top of the GNR array fabricated on 700 nm thick MgF2 supported on Si substrate. Incident IR light excites plasmon resonance across the GNR: S, source; D, drain. (b) SEM image of a GNR array with a ribbon width (W) of 100 nm and a period width (P) of 140 nm. (c) The electric transfer curve (green curve) and carrier density (red line) of the double layered graphene/MgF2 sensor. The black arrow is the CNP.
    Comparison between double layered graphene plasmon and single layer graphene plasmon. (a) Experimental extinction spectra comparison between single layer graphene and double layered graphene at Vg=−8 V. Ribbon width, 100 nm; period, 140 nm. (b) Simulated near-field enhancement distribution |E/E0| at the edge of single layer graphene (1000 cm−1) and double layered graphene (1350 cm−1) GNRs at their resonant frequencies. (c) Simulated extinction spectra of double layered GNR with EF, single layer graphene with |EF| and 2|EF|. Fermi level EF = 0.2, 0.3, 0.4, 0.5 eV. (d) Near-field enhancement distribution |E/E0| along the white dashed line in (b), EF = 0.3 eV; mobility is using 600 cm2/(V·s).
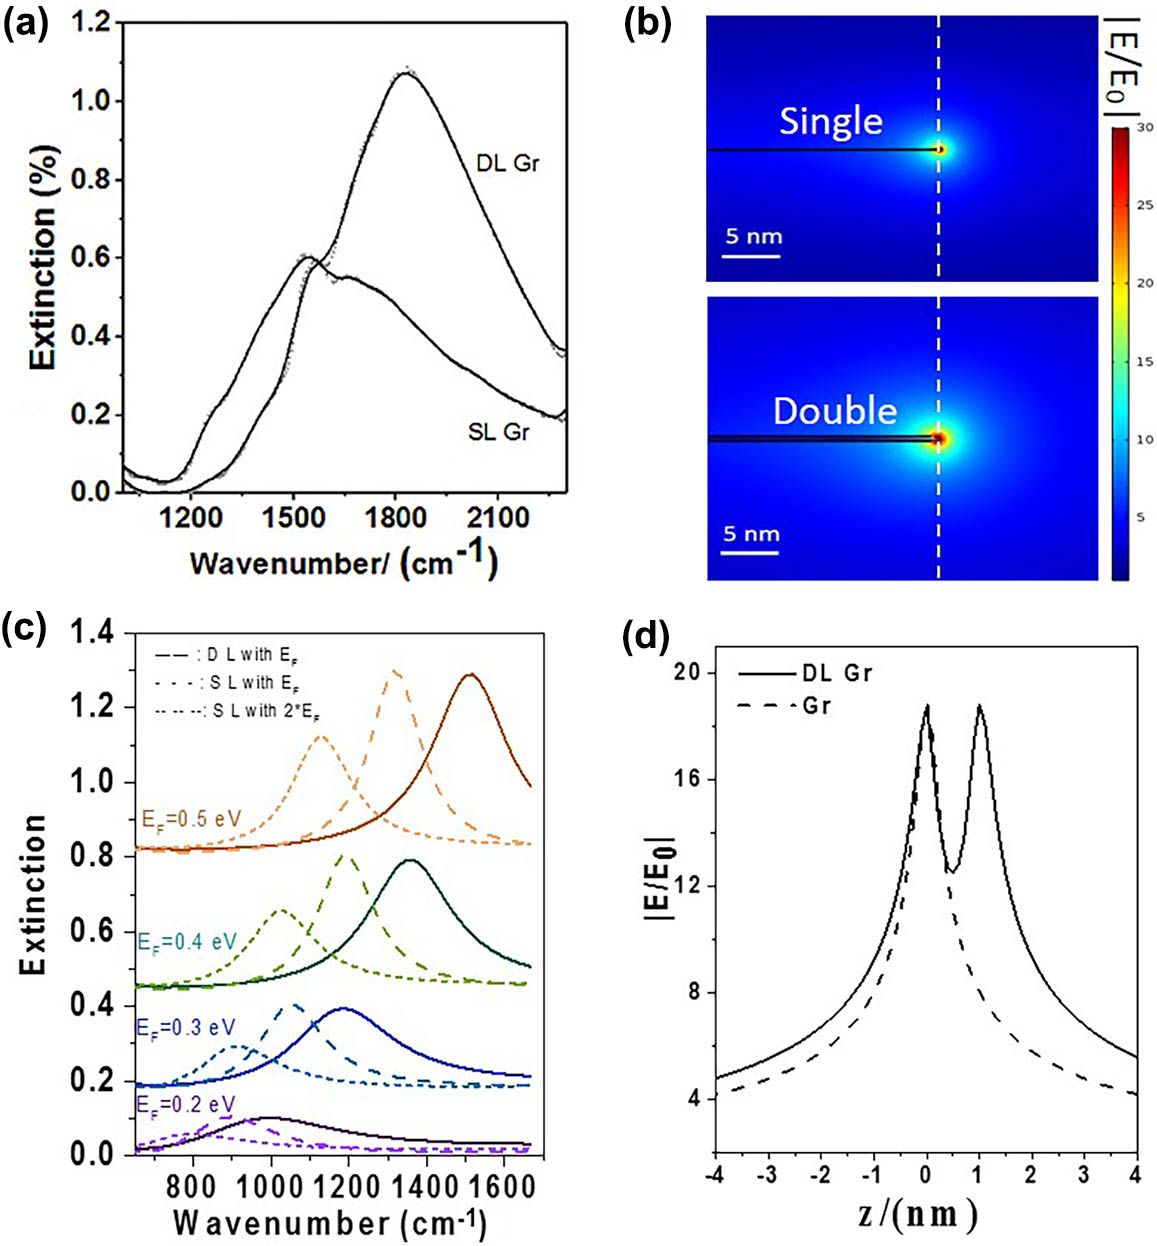
    Fig. 2. Comparison between double layered graphene plasmon and single layer graphene plasmon. (a) Experimental extinction spectra comparison between single layer graphene and double layered graphene at Vg=8V. Ribbon width, 100 nm; period, 140 nm. (b) Simulated near-field enhancement distribution |E/E0| at the edge of single layer graphene (1000cm1) and double layered graphene (1350cm1) GNRs at their resonant frequencies. (c) Simulated extinction spectra of double layered GNR with EF, single layer graphene with |EF| and 2|EF|. Fermi level EF=0.2, 0.3, 0.4, 0.5 eV. (d) Near-field enhancement distribution |E/E0| along the white dashed line in (b), EF=0.3eV; mobility is using 600cm2/(V·s).
    Enhanced IR spectroscopy of nanoscale proteins. (a) Extinction spectrum of the GNR (ΔCNP=−15 V) after the protein layer formation (red curve). The pristine extinction spectrum of a 9 nm thick protein layer is shown as the black curve. The pink vertical lines indicate the vibrational fingerprints of backbone (A and B), while the orange ones correspond to the side chain and endpoint (C and D). (b) Partially representative molecular structure of BSA, containing a peptide bond, a carboxyl-terminal end, and a side chain (CH3 is taken as an example); vibrational fingerprints of BSA and their positions in (a). ν, stretching vibration; υs, symmetric stretching vibration; δ, in-plane bending vibration; δas, asymmetric in-plane bending vibration. “+” denotes the coupling between different vibration modes, and the former contributes more than the latter. (c) Extinction spectra of the GNR after the protein layer formation at different gate voltages (solid lines). The baselines derived from the pristine plasmon extinction spectra are shown as dashed lines. (d) The plasmonic enhanced signal at different effective gate voltages were obtained by subtracting the corresponding baseline from each measured extinction curve in (c).
    Fig. 3. Enhanced IR spectroscopy of nanoscale proteins. (a) Extinction spectrum of the GNR (ΔCNP=15V) after the protein layer formation (red curve). The pristine extinction spectrum of a 9 nm thick protein layer is shown as the black curve. The pink vertical lines indicate the vibrational fingerprints of backbone (A and B), while the orange ones correspond to the side chain and endpoint (C and D). (b) Partially representative molecular structure of BSA, containing a peptide bond, a carboxyl-terminal end, and a side chain (CH3 is taken as an example); vibrational fingerprints of BSA and their positions in (a). ν, stretching vibration; υs, symmetric stretching vibration; δ, in-plane bending vibration; δas, asymmetric in-plane bending vibration. “+” denotes the coupling between different vibration modes, and the former contributes more than the latter. (c) Extinction spectra of the GNR after the protein layer formation at different gate voltages (solid lines). The baselines derived from the pristine plasmon extinction spectra are shown as dashed lines. (d) The plasmonic enhanced signal at different effective gate voltages were obtained by subtracting the corresponding baseline from each measured extinction curve in (c).
    Chenchen Wu, Ning Liu, Hai Hu, Xiangdong Guo, Baoxin Liao, Jiaming Liu, Liming Wang, Chunying Chen, Xiaoxia Yang, Qing Dai. Detecting molecular vibrational modes of side chains and endpoints in nanoscale proteins with graphene plasmon[J]. Chinese Optics Letters, 2019, 17(6): 062401
    Download Citation