Abstract
Monitoring the chemical and structural changes in protein side chains and endpoints by infrared (IR) spectroscopy is important for studying the chemical reaction and physical adsorption process of proteins. However, the detection of side chains and endpoints in nanoscale proteins is still challenging due to its weak IR response. Here, by designing a double layered graphene plasmon sensor on MgF2/Si substrate in the IR fingerprint region, we detect the vibrational modes in side chains and endpoints (1397 cm 1 and 1458 cm 1) of monolayer protein. The sensor could be applied on biochemistry to investigate the physical and chemical reaction of biomolecules.The identification and structure determination of protein is of great importance in studying its biofunctions, interactions, and reactions[1]. Currently, there are several techniques that can provide the structural information of proteins, such as X-ray diffraction[2], nuclear magnetic resonance (NMR)[3], cryo-electron microscopy[4], circular dichroism[5], and infrared (IR) spectroscopy[6,7]. X-ray diffraction can provide high resolution structures for protein crystals, but there are plenty of proteins that cannot be crystallized[2,8]. NMR can measure the protein structures and investigate binding of proteins and small molecules; however, it is limited to relatively small proteins (molecular weight below 3000, in general) and needs large amounts of protein[6]. Although cryo-electron microscopy can give high resolution structures of very small samples in the physiological state, it is still haunted by low signal to noise ratio and time-consuming sample preparation, and it is costly[4]. Circular dichroism needs complex data analysis. Thus, IR spectroscopy is the most convenient one that is the least demanding, both in terms of sample and time requirements, among all these methods.
In IR spectroscopy, it is hard to detect nanoscale proteins directly due to their weak light–matter interaction. By taking the advantage of plasmonic near-field enhancement to largely increase the interaction of molecules and the IR light, surface enhanced IR spectroscopy provides a sensitive method to identify nanoscale proteins, as well as protein adsorption processes[9–12]. However, the detection of side chains and endpoints in nanoscale proteins is still challenging due to their weak IR response, as well as the lack of plasmonic enhancement in the IR fingerprint region. The side chains and endpoints are closely related to protein chemical reaction and physical absorption[13–16]. For example, the protonation state of most side chains can be reflected in the IR spectrum, such as protonation of asparagine and glutamine residues accompanying proton pumping by bacteriorhodopsin[17], electron transfer reactions, and release from the -ATPase of sarcoplasmic reticulum during the catalytic cycle in Ref. [18]. However, due to their weak IR response, as well as the lack of plasmonic enhancement in the IR fingerprint region, the detection of the side chains and endpoints of nanoscale proteins is still challenging.
Two-dimensional materials, such as graphene, black phosphorus, and , have demonstrated exotic photonic properties, such as strong light–matter interaction and electrical tunability[19–22], and have been widely used in waveguide, laser, IR sensor, polarizer, and so on[23–25]. Graphene plasmon is used to enhance IR spectroscopy for detecting nanoscale materials due to its ultra-high IR light confinement and electrical tunability[26,27]. For example, a high-sensitivity plasmonic biosensor for label-free detection of protein monolayers was demonstrated[28]. But, due to the strong absorption of the substrate phonons, the signal of side chains in the fingerprint region has not been observed. Here, we adopt IR transparent substrate and double layered graphene to achieve high plasmonic enhancement in the fingerprint region and detect the side chains and endpoints of nanoscale protein. This kind of sensor supplies a convenient method to monitor both the backbone and side chains of nanoscale proteins, which can be used for investigating the chemical reaction and physical adsorption of proteins.
Sign up for Chinese Optics Letters TOC. Get the latest issue of Chinese Optics Letters delivered right to you!Sign up now
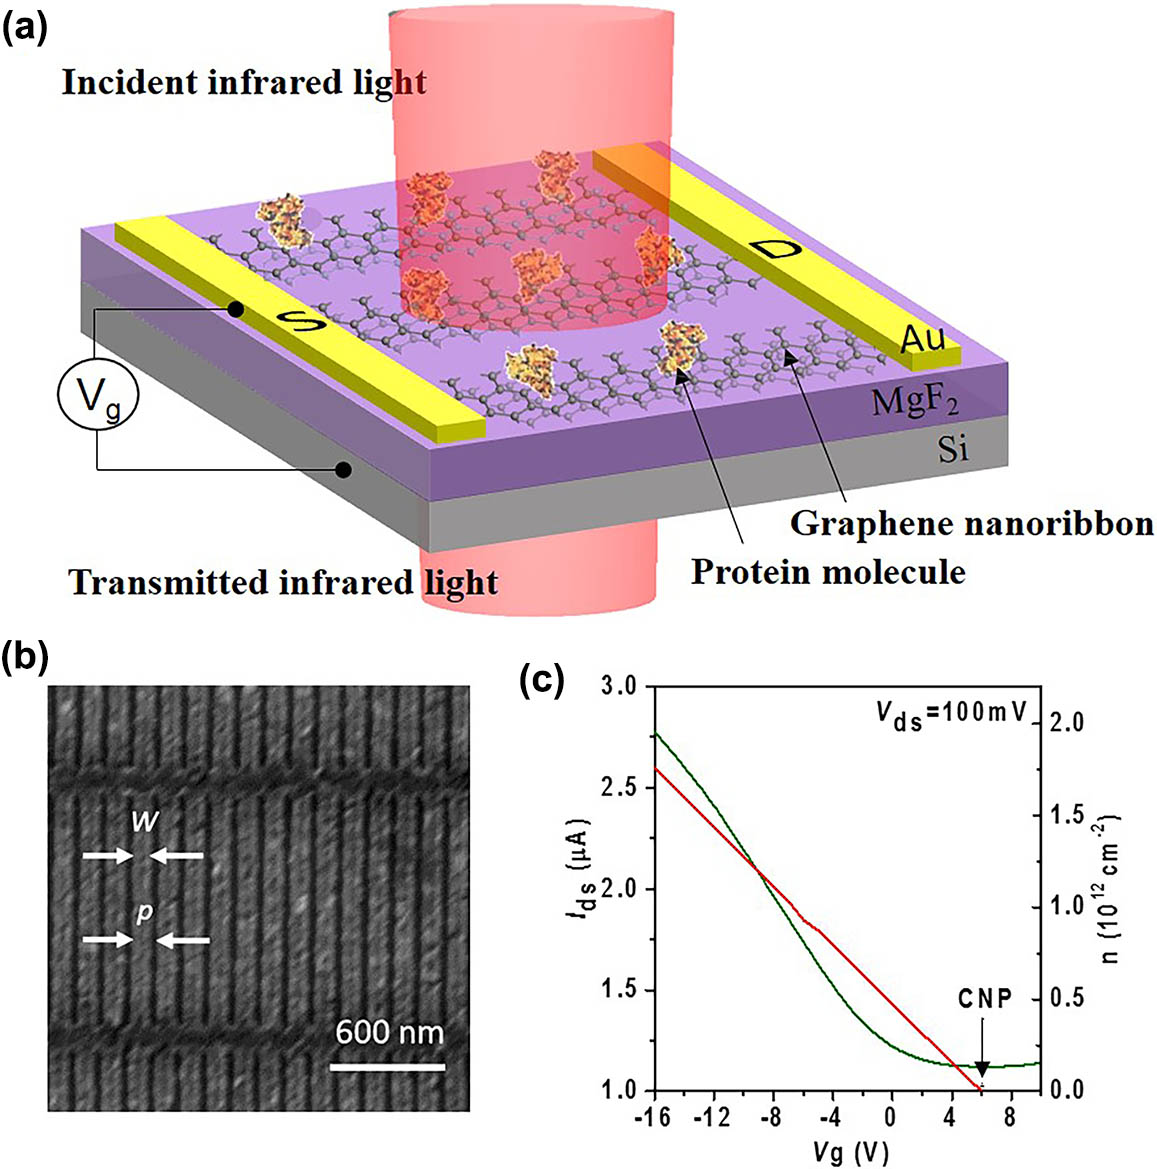
The double layered graphene plasmon molecular fingerprint sensor is illustrated in Fig. 1(a). Plasmons can be excited in the double layered graphene nanoribbons (GNRs) by focused IR beam, which result in highly confined electromagnetic fields that can enhance the IR absorption of nanoscale proteins[27–29]. The devices were fabricated as follows. A 700 nm thick thin film was evaporated on a low-doped Si substrate as an IR transparent substrate and back gate for graphene devices. We used film instead of traditional film as the dielectric due to having no active phonon absorption in the IR spectral range, which can maintain the undisturbed high electromagnetic field enhancement in the fingerprint region. Two graphene layers were transferred onto the substrate by repeating a wet transfer method[30]. Then, electrically continuous GRNs were fabricated in the double layered graphene via electron beam lithography (EBL) and oxygen ion etching. Au electrodes were deposited onto the GRN via a second EBL process and electron beam evaporation. For comparison, similar devices were fabricated with one layer graphene. Figure 1(b) displays a typical scanning electron microscope (SEM) image of the GNR, which shows uniform width and well-defined edges. The ribbon-to-pitch ratio of the ribbon array is 2.5, and the high density of the GNRs is designed to achieve high plasmon extinction strength. The electrostatic tunability of the double layered device was tested, and the electric transfer curve is shown in Fig. 1(c). The charge neutral point (CNP) of double layered graphene is at of about 6 V. The graphene carrier density can be tuned up to at . Detailed calculation is in Appendix A.

Figure 1.Graphene plasmon biosensor. (a) Schematic of the graphene plasmon sensor. Monolayer protein was deposited on top of the GNR array fabricated on 700 nm thick supported on Si substrate. Incident IR light excites plasmon resonance across the GNR: S, source; D, drain. (b) SEM image of a GNR array with a ribbon width () of 100 nm and a period width () of 140 nm. (c) The electric transfer curve (green curve) and carrier density (red line) of the double layered sensor. The black arrow is the CNP.
In the experiment, the plasmonic response of the double layered GNRs was characterized by using Fourier transform IR (FTIR) microscopy. The transmission spectra of the GNR arrays at CNP () were used as background spectra; then, the transmission spectra () at certain Fermi levels were collected to obtain the plasmonic extinction spectra . At the same graphene ribbon width and bias voltage, the typical extinction spectra of the double layered GNR devices, as well as the monolayer devices, are shown in Fig. 2(a). They both have one prominent peak, indicating no substrate phonon effects from the substrate. However, the extinction peak of double layered graphene is much higher than that of the single layer graphene at , because the Fermi level of double layered graphene is the sum of two single layer graphene at same bias voltage[29]. By using the finite element method, we simulate the electric field distribution for the GNRs at the plasmon resonance frequency. As illustrated in Fig. 2(b), the field hotspots are located along the edges of the GNRs, and the separation distance between two graphene layers is set as 1 nm. The cross section of the hot spot at the double layered GNR is much larger than that of the monolayer GNR. When each layer of the double layered graphene has the same initial carrier density, the simulation results in Fig. 2(c) show that the extinction of double layered graphene plasmon is higher than that of single layer graphene plasmon, and the peak is shifted to a higher frequency at the same Fermi level and ribbon width. Then, we apply (, 0.3, 0.4, 0.5 eV) on single layer graphene; the simulated extinction strength of single layer graphene plasmon is generally the same as the strength of double layered graphene plasmon with . It can be explained by the Drude model of graphene conductivity[29,31]: where is the Fermi velocity, is carrier density, is the frequency, and is the scattering rate. Because and , we can conclude that (when ); the reason for double layered graphene plasmon extinction moving towards higher frequency is the coupling between two graphene layers[32]. For quantitative examination, the convolution of the near-field enhancement distribution with the perpendicular distance from the ribbon edge [along the dashed line in Fig. 2(b), 0.5 nm away from the ribbon edge] is shown in Fig. 2(d). It indicates that the optical enhancement and field distribution in double layered graphene ribbons is like the single layer graphene ribbons. Both the experiment and simulation results show that the double layered graphene plasmon can provide more effective optical enhancement rather than the single layer graphene plasmon for the higher doping and broader tunability.
Figure 2.Comparison between double layered graphene plasmon and single layer graphene plasmon. (a) Experimental extinction spectra comparison between single layer graphene and double layered graphene at . Ribbon width, 100 nm; period, 140 nm. (b) Simulated near-field enhancement distribution at the edge of single layer graphene () and double layered graphene () GNRs at their resonant frequencies. (c) Simulated extinction spectra of double layered GNR with , single layer graphene with and . Fermi level , 0.3, 0.4, 0.5 eV. (d) Near-field enhancement distribution along the white dashed line in (b), ; mobility is using .
Bovine serum albumin (BSA), a kind of protein derived from cows that is often used as the protein concentration standard in the lab, was selected as an example to demonstrate the performance of a double layered graphene biosensor. Monolayer protein films (about 9 nm thick) were spin-coated onto the graphene devices as well as a spare substrate. A typical plasmonic extinction spectrum obtained after the protein layer coating is shown in Fig. 3(a) (red curve). As a comparison, the pristine IR absorption of the protein monolayer taken on the spare substrate is also displayed in Fig. 3(a) (black curve). The IR absorption of the protein monolayer without plasmon enhancement is very weak and only the strongest peaks, i.e., amide I and amide II (marked as C and D), can be distinguished from the background noise due to the weak light–molecule interaction. In striking contrast to the noisy results without plasmon enhancement, the extinction spectrum of the same protein film covering the double layered GNR array features additional strong dips at A and B besides at C and D. The dip behaviors in the plasmonic extinction peak originated from destructive interference when the graphene plasmons and BSA’s vibrational modes interacted with an opposite phase relationship[31–35]. These dips can be assigned to the molecular fingerprints of the protein molecules. The partially representative molecular structure of BSA and assignments of vibrational fingerprints of BSA are illustrated in Fig. 3(b): BSA containing a peptide bond (-CO-NH-), which is the major part of the protein backbone at C and D, a carboxyl-terminal end at A (-OH), and a side chain at B (-)[34]. It indicates that not only the protein backbone but also the side chains vibrational modes are detected by the graphene plasmon sensor. It is the first time, to the best of our knowledge, that the side chains and endpoint vibrational modes ( and ) in the fingerprint range of nanoscale proteins are detected by an IR sensor.
Figure 3.Enhanced IR spectroscopy of nanoscale proteins. (a) Extinction spectrum of the GNR () after the protein layer formation (red curve). The pristine extinction spectrum of a 9 nm thick protein layer is shown as the black curve. The pink vertical lines indicate the vibrational fingerprints of backbone (A and B), while the orange ones correspond to the side chain and endpoint (C and D). (b) Partially representative molecular structure of BSA, containing a peptide bond, a carboxyl-terminal end, and a side chain ( is taken as an example); vibrational fingerprints of BSA and their positions in (a). , stretching vibration; , symmetric stretching vibration; , in-plane bending vibration; , asymmetric in-plane bending vibration. “+” denotes the coupling between different vibration modes, and the former contributes more than the latter. (c) Extinction spectra of the GNR after the protein layer formation at different gate voltages (solid lines). The baselines derived from the pristine plasmon extinction spectra are shown as dashed lines. (d) The plasmonic enhanced signal at different effective gate voltages were obtained by subtracting the corresponding baseline from each measured extinction curve in (c).
Extinction spectra of the GNR array after the protein layer formation at different gate voltages are shown as solid lines in Fig. 3(c). For the evaluation of the signal enhancement, plasmon enhanced molecular vibrational signals were extracted from the extinction spectra of the GNR arrays with the protein layer (solid lines) by subtracting the extinction spectra obtained without the protein layer (dashed lines). The extracted signals are shown in Fig. 3(d). The enhancement is calculated via the subtraction of the enhanced signal and origin protein signal and then divided by the origin protein signal. The signal strength of vibrational modes gradually increases, and the enhancement factors increase from 1.6 to 2.6, because the graphene plasmon resonance frequency is gradually approaching the enhanced modes by tuning from to . The double layered graphene plasmon broadband electrical tunability and higher doping offers adjustable enhancement at different modes, which could be used to monitor physicochemical changes in protein backbones, endpoints, and side chains.
We detected both the protein backbone and side chains of monolayer protein film by using the undisturbed double layered graphene plasmon enhanced IR spectroscopy. Experimental results combined with the numerical simulation show that the double layered graphene plasmon has nearly doubled the cross section of the monolayer graphene plasmon. By using the double layered graphene plasmon device with an IR transparent substrate as the IR sensor, the protein backbone (, ) is enhanced by about 1.6–2.6 times, and the side chains and endpoints (, -COOH) of 9 nm thick BSA can be identified, which cannot be detected without the plasmonic enhancement. This work paves the way for monitoring the behavior of nanomaterials and the chemical reaction or absorption that occur on endpoints and side chains, as well as the physical change of the protein backbone, such as the interaction between proteins and nanomaterial medicine carriers.
References
[1] D. Baker, A. Sali. Science, 294, 93(2001).
[2] A. Wlodawer, R. Bott, L. Sjoh. J. Biol. Chem., 257, 1325(1982).
[3] W. Braun. Q. Rev. Biophys., 19, 115(1987).
[4] W. Zhang, P. R. Chipman, J. Corver, P. R. Johnson, Y. Zhang, S. Mukhopadhyay, R. J. Kuhn. Nat. Struct. Mol. Biol., 10, 907(2003).
[5] P. Manavalan, W. C. Johnson. Nature, 305, 831(1983).
[6] J. N. Anker, W. P. Hall, O. Lyandres, N. C. Shah, J. Zhao, R. P. Van Duyne. Nat. Mater., 7, 442(2008).
[7] A. A. Yanik, M. Huang, O. Kamohara, A. Artar, T. W. Geisbert, J. H. Connor, H. Altug. Nano Lett., 10, 4962(2010).
[8] L. M. Wang, J. Y. Li, J. Pan, X. M. Jiang, Y. L. Ji, Y. F. Li, Y. Qu, Y. L. Zhao, X. C. Wu, C. Y. Chen. J. Am. Chem. Soc., 135, 17359(2013).
[9] Y. Aboul-Enein, A. A. Bunacio, S. Fleschin. Gazi Univ. J. Sci., 27, 637(2014).
[10] L. Wang, L. Yan, J. Liu, C. Chen, Y. Zhao. Anal. Chem., 90, 589(2018).
[11] A. Barth. Biophys. Acta, 1767, 1073(2007).
[12] E. Kauffmann, N. C. Darnton, R. H. Austin, C. Batt, K. Gerwert. Proc. Natl. Acad. Sci. USA, 98, 6646(2001).
[13] B. H. Stuart. Infrared Spectroscopy: Fundamentals and Applications(2005).
[14] F. Heinz, M. Werner. Infrared Spectroscopy of Proteins. Handbook of Vibrational Spectroscopy(2006).
[15] A. Barth, V. N. Uversky, E. A. Permyakov. IR spectroscopy. Protein Structures: Methods in Protein Structure and Stability Analysis(2006).
[16] A. Barth. Progress Biophys. Mol. Biol., 74, 141(2000).
[17] C. Zscherp, J. Heberle. J. Phys. Chem. B, 101, 10542(1997).
[18] A. Barth, W. Mäntele, W. Kreutz. Biochim. et Biophys. Acta (BBA)-Bioenerget., 1057, 115(1991).
[19] Y. Liu, T. Sun, W. Ma, W. Yu, S. B. Nanjunda, S. Li, Q. Bao. Chin. Opt. Lett., 16, 020002(2018).
[20] S. C. Dhanabalan, J. S. Ponraj, Z. Guo, S. Li, Q. Bao, H. Zhang. Adv. Sci., 4, 1600305(2017).
[21] K. S. Novoselov, A. Mishchenko, A. Carvalho, A. C. Neto. Science, 353, aac9439(2016).
[22] S. C. Dhanabalan, J. S. Ponraj, H. Zhang, Q. Bao. Nanoscale, 8, 6410(2016).
[23] Q. Bao, H. Zhang, B. Wang, Z. Ni, C. H. Y. X. Lim, Y. Wang, K. P. Loh. Nat. Photon., 5, 411(2011).
[24] Q. Bao, H. Zhang, Y. Wang, Z. Ni, Y. Yan, Z. X. Shen, D. Y. Tang. Adv. Funct. Mater., 19, 3077(2009).
[25] P. Tang, Y. Tao, Y. Mao, M. Wu, Z. Huang, S. Liang, X. Chen, X. Qi, B. Huang, J. Liu, C. Zhao. Chin. Opt. Lett., 16, 020012(2018).
[26] F. Garczarek, K. Gerwert. Nature, 439, 109(2006).
[27] H. Hu, X. Yang, F. Zhai, D. Hu, R. Liu, K. Liu, Z. Sun, Q. Dai. Nat. Commu., 7, 12334(2016).
[28] D. Rodrigo, O. Limaj, D. Janner, D. Etezadi, F. J. G. De Abajo, V. Pruneri, H. Altug. Science, 349, 165(2015).
[29] D. Rodrigo, A. Tittl, O. Limaj, F. J. G. De Abajo, V. Pruneri, H. Altug. Light: Sci. Appl., 6, e16277(2017).
[30] S. Kim, S. Shin, T. Kim, H. Du, M. Song, C. Lee, S. Seo. Carbon, 98, 352(2016).
[31] J. Horng, C. F. Chen, B. Geng, C. Girit, Y. Zhang, Z. Hao, Y. R. Shen. Phys. Rev. B, 83, 165113(2011).
[32] D. Sun, M. Wang, Y. Huang, Y. Zhou, M. Qi, M. Jiang, Z. Ren. Chin. Opt. Lett., 15, 051603(2017).
[33] H. Yan, T. Low, W. Zhu, Y. Wu, M. Freitag, X. Li, F. Xia. Nat. Photon., 7, 394(2013).
[34] K. Murayama, M. Tomida. Biochemistry, 43, 11526(2004).
[35] S. Dai, Q. Ma, M. K. Liu, T. Andersen, Z. Fei, M. D. Goldflam, F. Keilmann. Nat. Nanotech., 10, 682(2015).