• Spectroscopy and Spectral Analysis
  • Vol. 42, Issue 4, 1250 (2022)
Lian-jie LI1、*, Shu-xiang FAN2、2;, Xue-wen WANG1、1;, Rui LI1、1;, Xiao WEN1、1;, Lu-yao WANG1、1;, and Bo LI1、1; *;
Author Affiliations
  • 11. College of Mechanical and Vehicle Engineering, Taiyuan University of Technology, Taiyuan 030024, China
  • 22. Beijing Research Center of Intelligent Equipment for Agriculture, Beijing 100097, China
  • show less
    DOI: 10.3964/j.issn.1000-0593(2022)04-1250-07 Cite this Article
    Lian-jie LI, Shu-xiang FAN, Xue-wen WANG, Rui LI, Xiao WEN, Lu-yao WANG, Bo LI. Classification Method of Coal and Gangue Based on Hyperspectral Imaging Technology[J]. Spectroscopy and Spectral Analysis, 2022, 42(4): 1250 Copy Citation Text show less
    Coal samples (a) and gangue samples (b)
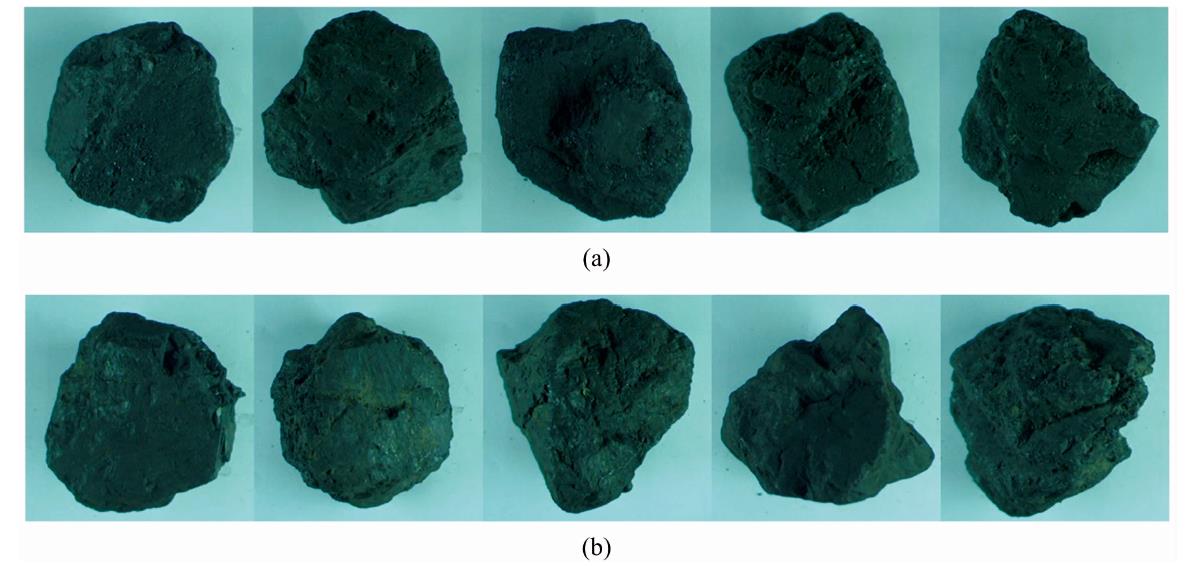
    Fig. 1. Coal samples (a) and gangue samples (b)
    Hyperspectral imaging system (a) and process of spectrum extraction (b)
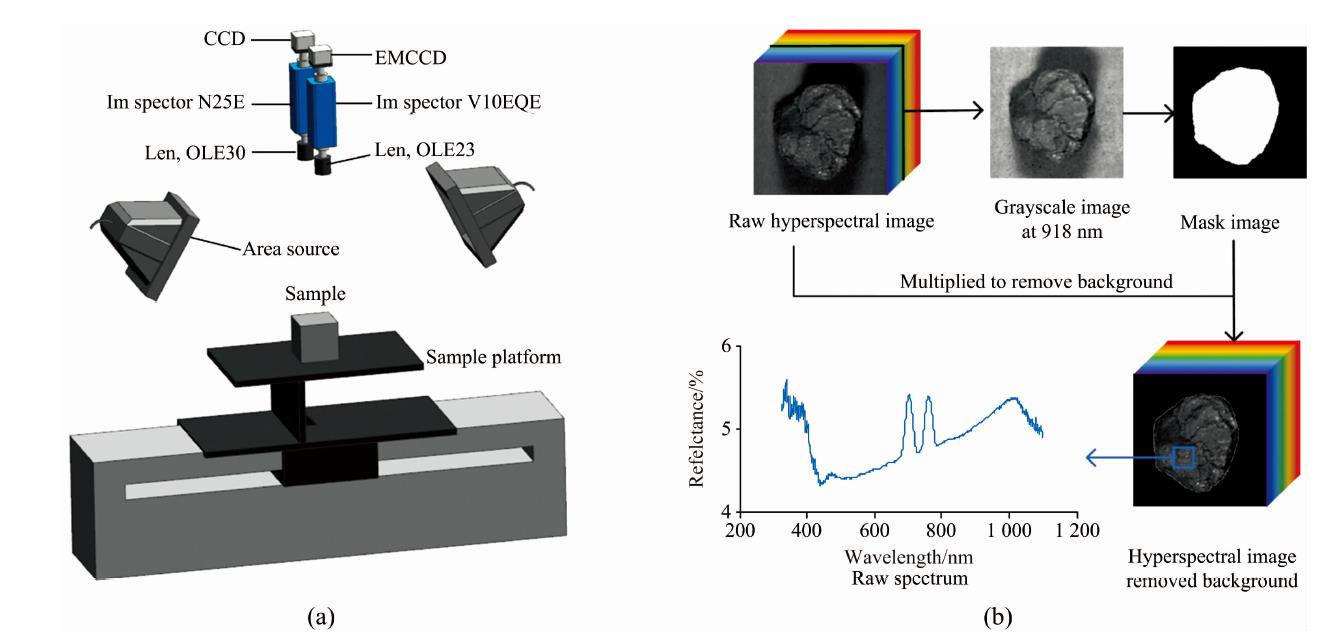
    Fig. 2. Hyperspectral imaging system (a) and process of spectrum extraction (b)
    The original spectral curves in the range of 474~940 nm (a) and 1 235~2 477 nm (b)
    Fig. 3. The original spectral curves in the range of 474~940 nm (a) and 1 235~2 477 nm (b)
    The process of variable selection by CARS in the spectral ranges of (a) Vis/NIR and (b) NIR
    Fig. 4. The process of variable selection by CARS in the spectral ranges of (a) Vis/NIR and (b) NIR
    The results of variable selection by SPA over the spectral ranges of (a), (c) Vis/NIR and (b), (d) NIR
    Fig. 5. The results of variable selection by SPA over the spectral ranges of (a), (c) Vis/NIR and (b), (d) NIR
    Grayscale images of some samples and corresponding classification visualizationred: Coal; blue: Gangue
    Fig. 6. Grayscale images of some samples and corresponding classification visualization
    red: Coal; blue: Gangue
    Spectral rangeNumber of variablesModelsensitivityspecificityaccuracy
    SVM1.000 00.956 50.979 2
    Vis/NIR600KNN1.000 00.956 50.979 2
    PLS-DA1.000 00.956 50.979 2
    SVM1.000 00.960 90.981 3
    NIR196KNN0.956 00.956 50.956 3
    PLS-DA1.000 00.987 00.993 8
    Table 1. Comparison of different classification models based on the full-band spectra
    Spectral
    range
    Variable selection
    methods
    Number of
    variables
    Modelsensitivityspecificityaccuracy
    Vis/NIRSVM1.000 00.930 40.966 7
    CARS5KNN0.976 00.930 40.954 2
    PLS-DA0.956 00.830 40.895 8
    SVM1.000 00.965 20.983 3
    SPA3KNN1.000 00.956 50.979 2
    PLS-DA0.776 00.869 60.820 8
    Vis/NIRSVM0.888 00.995 70.939 6
    CARS3KNN0.988 00.991 30.989 6
    PLS-DA1.000 00.965 20.983 3
    SVM0.960 00.947 80.954 2
    SPA3KNN0.960 00.943 50.952 1
    PLS-DA0.932 00.917 40.925 0
    Table 2. The prediction results of different classification models based on characteristic wavelengths
    Lian-jie LI, Shu-xiang FAN, Xue-wen WANG, Rui LI, Xiao WEN, Lu-yao WANG, Bo LI. Classification Method of Coal and Gangue Based on Hyperspectral Imaging Technology[J]. Spectroscopy and Spectral Analysis, 2022, 42(4): 1250
    Download Citation