• Laser & Optoelectronics Progress
  • Vol. 57, Issue 3, 031701 (2020)
Wenwen Shang1, Yawei Wang2, Shuangshuang Xue2, Guangwei Peng2, Hao Han1, and Yuanyuan Xu2、*
Author Affiliations
  • 1School of Mechanical Engineering, Jiangsu University, Zhenjiang, Jiangsu 212013, China
  • 2Faculty of Science, Jiangsu University, Zhenjiang, Jiangsu 212013, China
  • show less
    DOI: 10.3788/LOP57.031701 Cite this Article Set citation alerts
    Wenwen Shang, Yawei Wang, Shuangshuang Xue, Guangwei Peng, Hao Han, Yuanyuan Xu. Tongue Diagnosis Method Based on Comparative Analysis of Tongue Image Chromatography[J]. Laser & Optoelectronics Progress, 2020, 57(3): 031701 Copy Citation Text show less
    Tongue image segmentation
    Fig. 1. Tongue image segmentation
    Simulation diagrams of the superposition of tongue image positive and negative films. (a) Light red; (b) light white; (c) red; (d) twilight; (e) cyan-blue; (f) purple
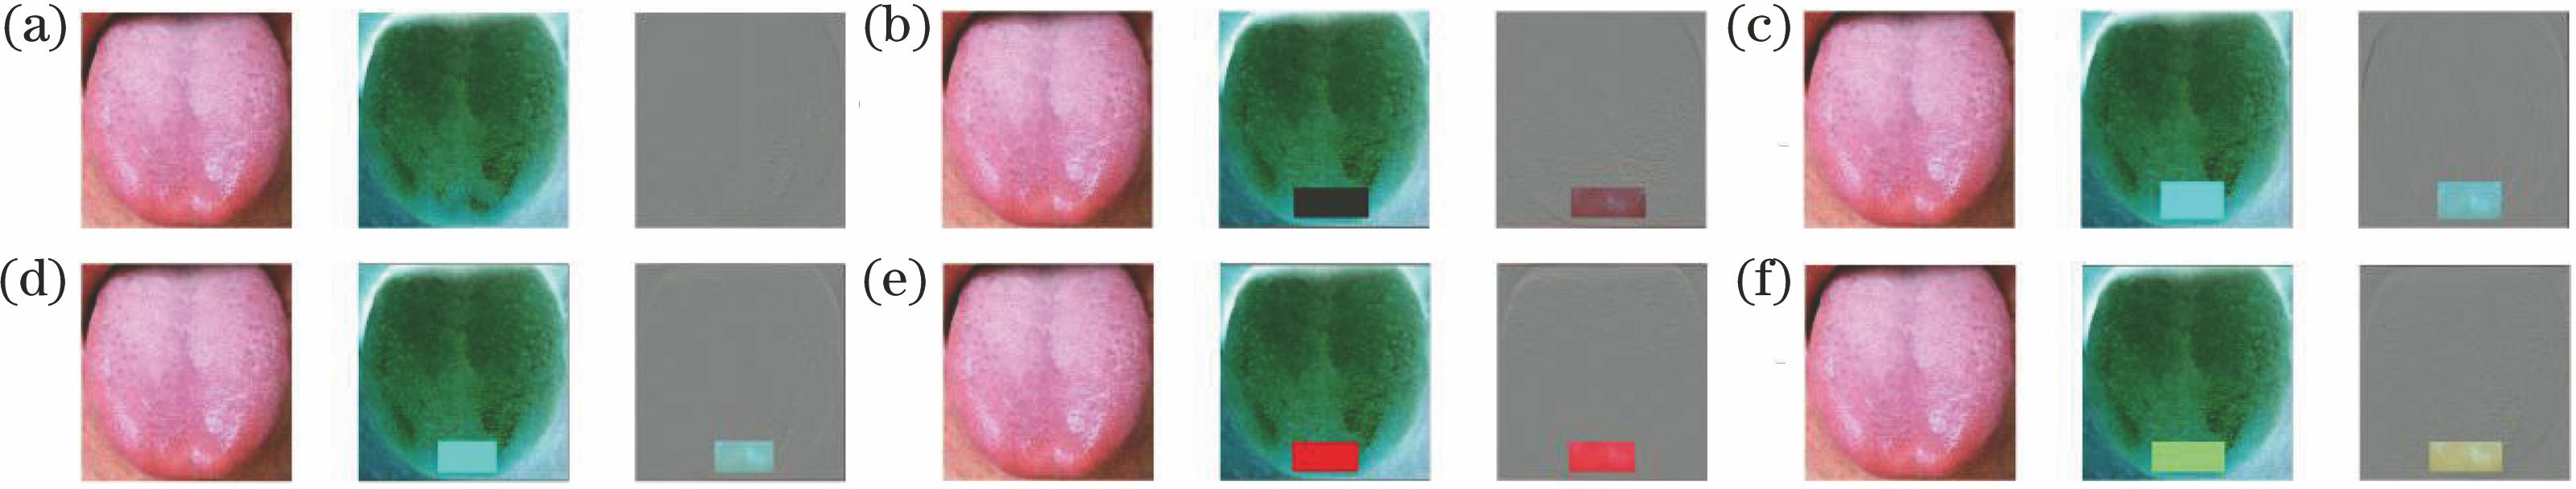
    Fig. 2. Simulation diagrams of the superposition of tongue image positive and negative films. (a) Light red; (b) light white; (c) red; (d) twilight; (e) cyan-blue; (f) purple
    Difference of synthetic film simulation parameters L*, a*, and b*
    Fig. 3. Difference of synthetic film simulation parameters L*, a*, and b*
    Experimental results of superposition of tongue image positive and negative films. (a) Light red; (b) light white; (c) red; (d) twilight; (e) cyan-blue; (f) purple
    Fig. 4. Experimental results of superposition of tongue image positive and negative films. (a) Light red; (b) light white; (c) red; (d) twilight; (e) cyan-blue; (f) purple
    Scatter plot of chromatographic spatial distribution. (a) Light red; (b) light white; (c) red; (d) twilight; (e) cyan-blue; (f) purple
    Fig. 5. Scatter plot of chromatographic spatial distribution. (a) Light red; (b) light white; (c) red; (d) twilight; (e) cyan-blue; (f) purple
    Scatter plot for tongue color classification of synthetic films
    Fig. 6. Scatter plot for tongue color classification of synthetic films
    Parameter L* line of tongue image synthetic film
    Fig. 7. Parameter L* line of tongue image synthetic film
    PhysiqueChroma valueLight red(x-±s)Light white(x-±s)Red/twilight(x-±s)Cyan-blue/purple(x-±s)
    Peace qualityL*55.91±1.4664.02±4.2649.13±2.0742.67±5.46
    a*37.39±2.6629.54±2.3745.60±1.7031.07±2.77
    b*18.93±2.4514.06±2.0621.51±2.058.56±2.26
    Sputumwet qualityL*57.55±1.9759.99±1.7748.55±2.4744.62±2.58
    a*36.47±2.0127.61±2.7944.00±2.9929.92±3.37
    b*17.51±3.1110.92±1.7020.76±2.536.87±3.61
    Wet heatqualityL*56.87±1.7960.35±2.0648.64±5.2946.37±5.96
    a*35.90±2.3525.20±3.8342.85±3.8530.21±2.63
    b*18.94±2.2010.76±2.5220.58±2.436.19±1.87
    Yin deficiencyqualityL*56.01±1.3661.51±2.1649.75±2.8946.16±3.48
    a*39.02±2.9028.00±4.0545.48±2.5030.16±1.08
    b*18.44±2.1112.28±2.2321.98±2.187.39±1.48
    Table 1. Relationship between tongue chroma value and physique
    Tongue colorL*a*b*
    Light red[50, 58][-2, 2][-1, 1]
    Light white[33, 44][14, 28][-9, 14]
    Red[68, 72][-26, -20][-21, -5]
    Twilight[69, 75][-25, -18][-16, -4]
    Cyan-blue[52, 60][61, 72][21, 50]
    Purple[73, 82][-19, -6][16, 34]
    Table 2. Simulation parameter range of synthetic films
    Tongue colorL*a*b*
    Light red[50, 57][-2, 11][-8, 2]
    Light white[45, 49][3, 19][-18, -2]
    Red[59, 67][-3, 11][-17, -3]
    Twilight[62, 70][-3, 9][-15, -2]
    Cyan-blue[53, 59][3, 16][-16, 3]
    Purple[76, 83][-1, 11][-16, 4]
    Table 3. Experimental parameter range of synthetic films
    Tongue colorInternal organFitting equation
    Light redNormalq=-0.05753o2-0.1177op+6.785o-0.07655p2+7.28p-205
    Light whiteKidneyq=0.04205o2+0.06796op-4.7o-0.006757p2-3.011p+118.2
    RedHeartq=-0.009147o2+0.03776op+1.084o-0.009451p2-2.461p-41.55
    TwilightStomachq=-0.01078o2+0.01269op+1.287o+0.01275p2-1.112p-47.06
    Cyan-blueLungq=0.05644o2+0.09939op-7.252o-0.08967p2-3.703p+215.3
    PurpleHeartq=0.005532o2-0.007552op-1.026o+0.008415p2+0.5093p+39.53
    Table 4. Summary of fitting equations for tongue image synthetic films
    Tongue colorSimulation dataExperimental data
    Light red[47, 55][50, 55]
    Light white[33, 47][45, 50]
    Red[64, 70][59, 65]
    Twilight[70, 74][65, 73]
    Cyan-blue[55, 64][55, 59]
    Purple[74, 82][73, 83]
    Table 5. Comparison of quantitative parameter L* between simulation and experiment
    Wenwen Shang, Yawei Wang, Shuangshuang Xue, Guangwei Peng, Hao Han, Yuanyuan Xu. Tongue Diagnosis Method Based on Comparative Analysis of Tongue Image Chromatography[J]. Laser & Optoelectronics Progress, 2020, 57(3): 031701
    Download Citation