
Min Ma, Yifei Liu, Shixi Wang. Electrical Capacitance Tomography Sensitivity Field Optimization Algorithm Based on Approximate L0 Norm[J]. Laser & Optoelectronics Progress, 2021, 58(12): 1210025
- Laser & Optoelectronics Progress
- Vol. 58, Issue 12, 1210025 (2021)
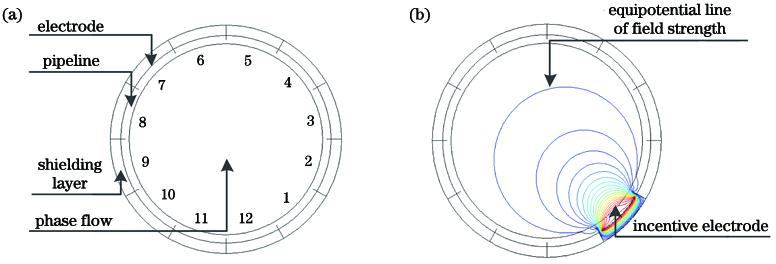
Fig. 1. ECT capacitance sensor. (a) Structure of 12-electrode ECT sensor; (b) excitation state of electrode 1
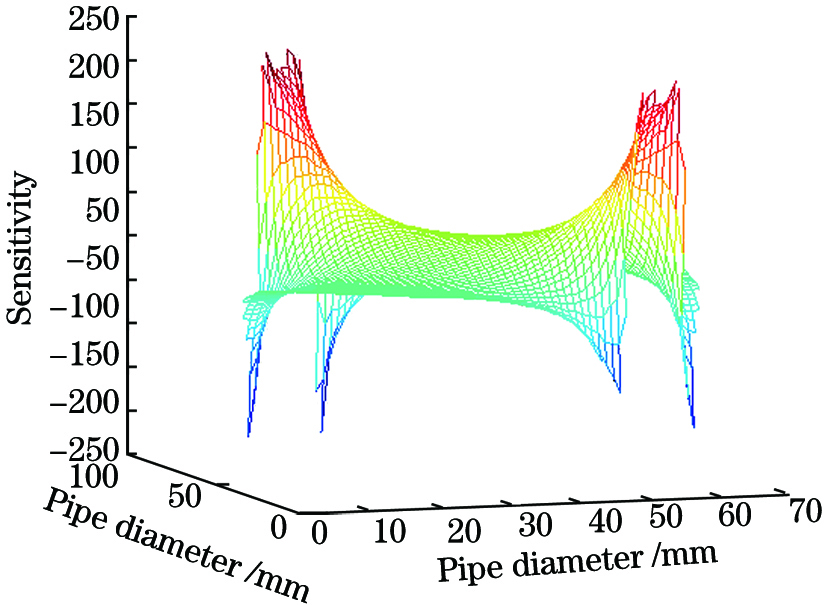
Fig. 2. Three-dimensional distribution model of sensitivity between 1-7 electrode couple
Fig. 3. Imaging region convolution model
Fig. 4. Comparison of sensitivity gradients between 1-7 electrode couple before and after updating. (a) Before updating; (b) after updating
Fig. 5. Updating process of finite element sensitivity. (a) Updating process of finite element sensitivity S(i,j)(u) in sensitive field; (b) updating process of adjacent finite element sensitivity S(i,j)(u)
Fig. 6. Change curves of sensitivity gradient of 1-7 electrode couple under different iteration times. (a) Original sensitivity curves; (b) Once; (c) Two times; (d) three times; (e) four times; (f) five times
Fig. 7. Diagram of segmentation network and pixel distribution
Fig. 8. Sensitive field intensity changes under different iteration times and imaging comparison with Landweber algorithm
Fig. 9. IME values with different iteration times
Fig. 10. CORR values with different iteration times
Fig. 11. Images made by different algorithms
Fig. 12. IME histograms of different algorithms
Fig. 13. CORR histograms of different algorithms
Fig. 14. 12 electrode ECT system
Fig. 15. Experimental results of static imaging
|
Table 1. IME results for different algorithms
|
Table 2. CORR results for different algorithms

Set citation alerts for the article
Please enter your email address
© Copyright 2018-2021 | Chinese Laser Press. All Rights Reserved 沪ICP备15018463号-20