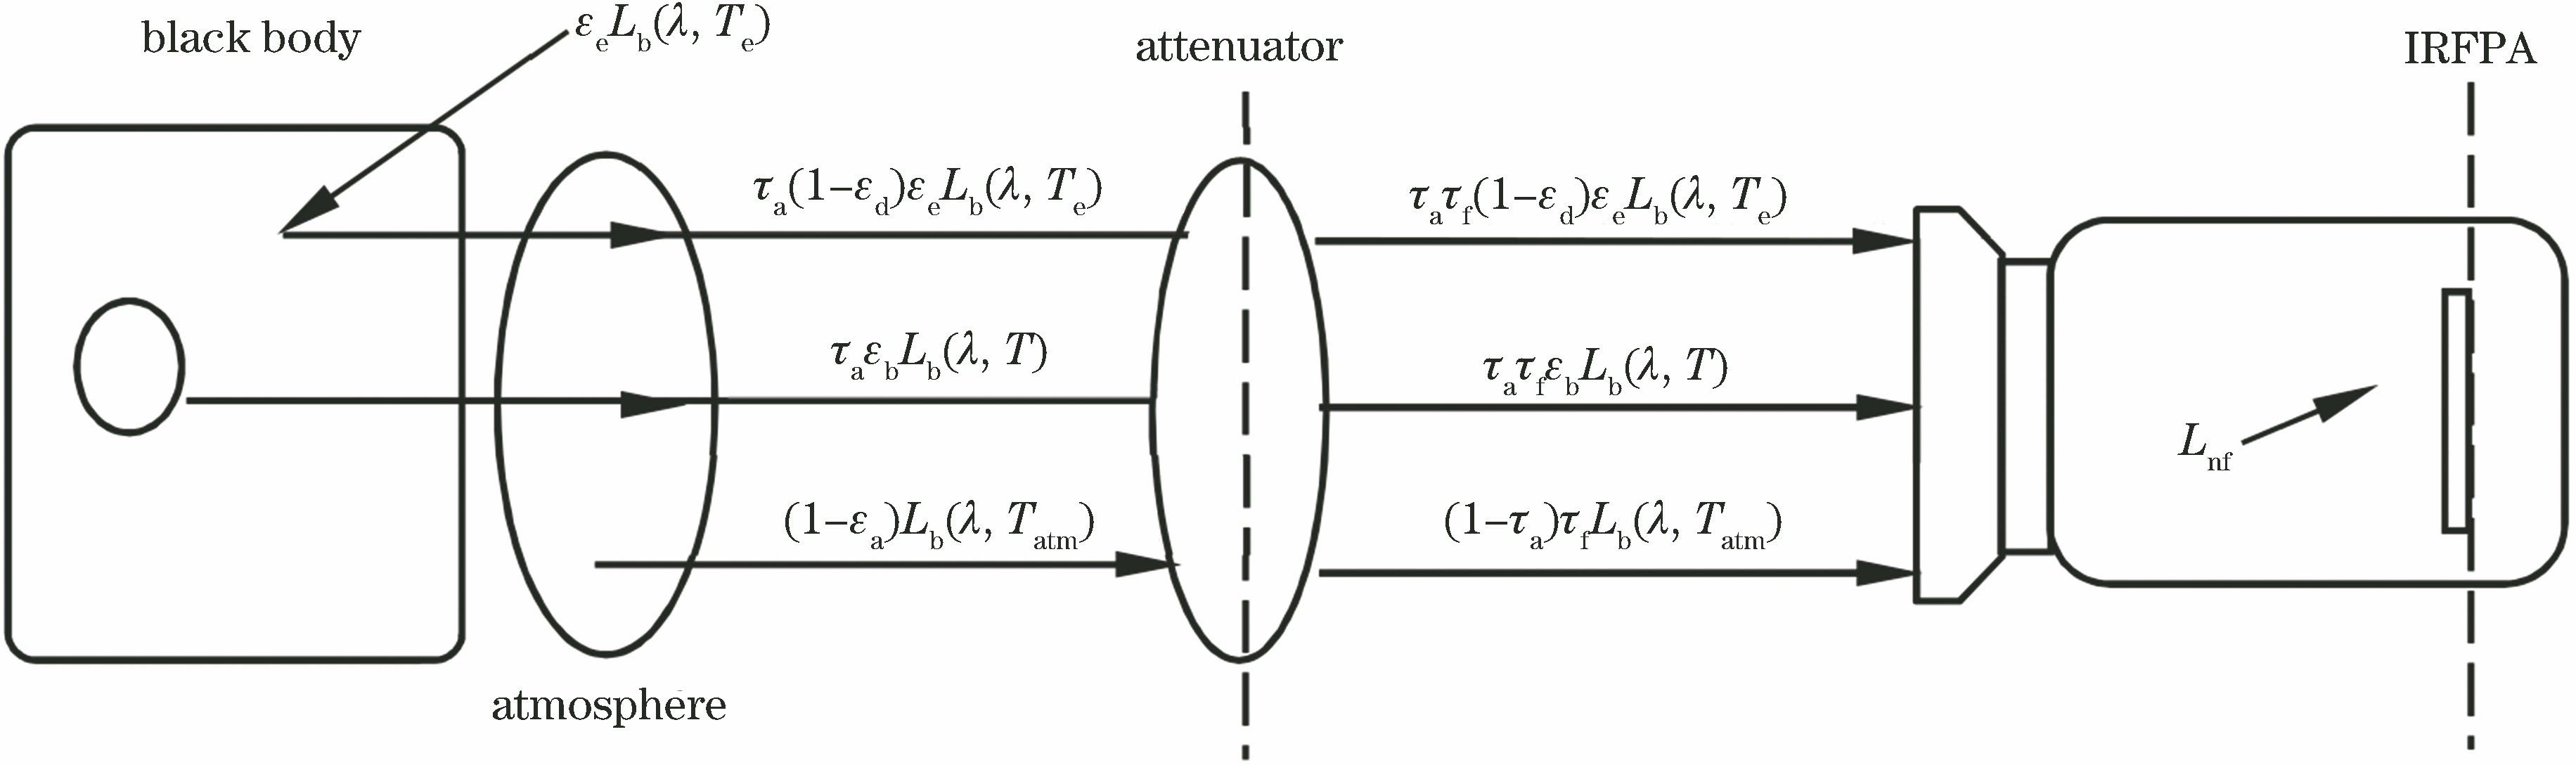
Fig. 1. Schematic of radiation sources
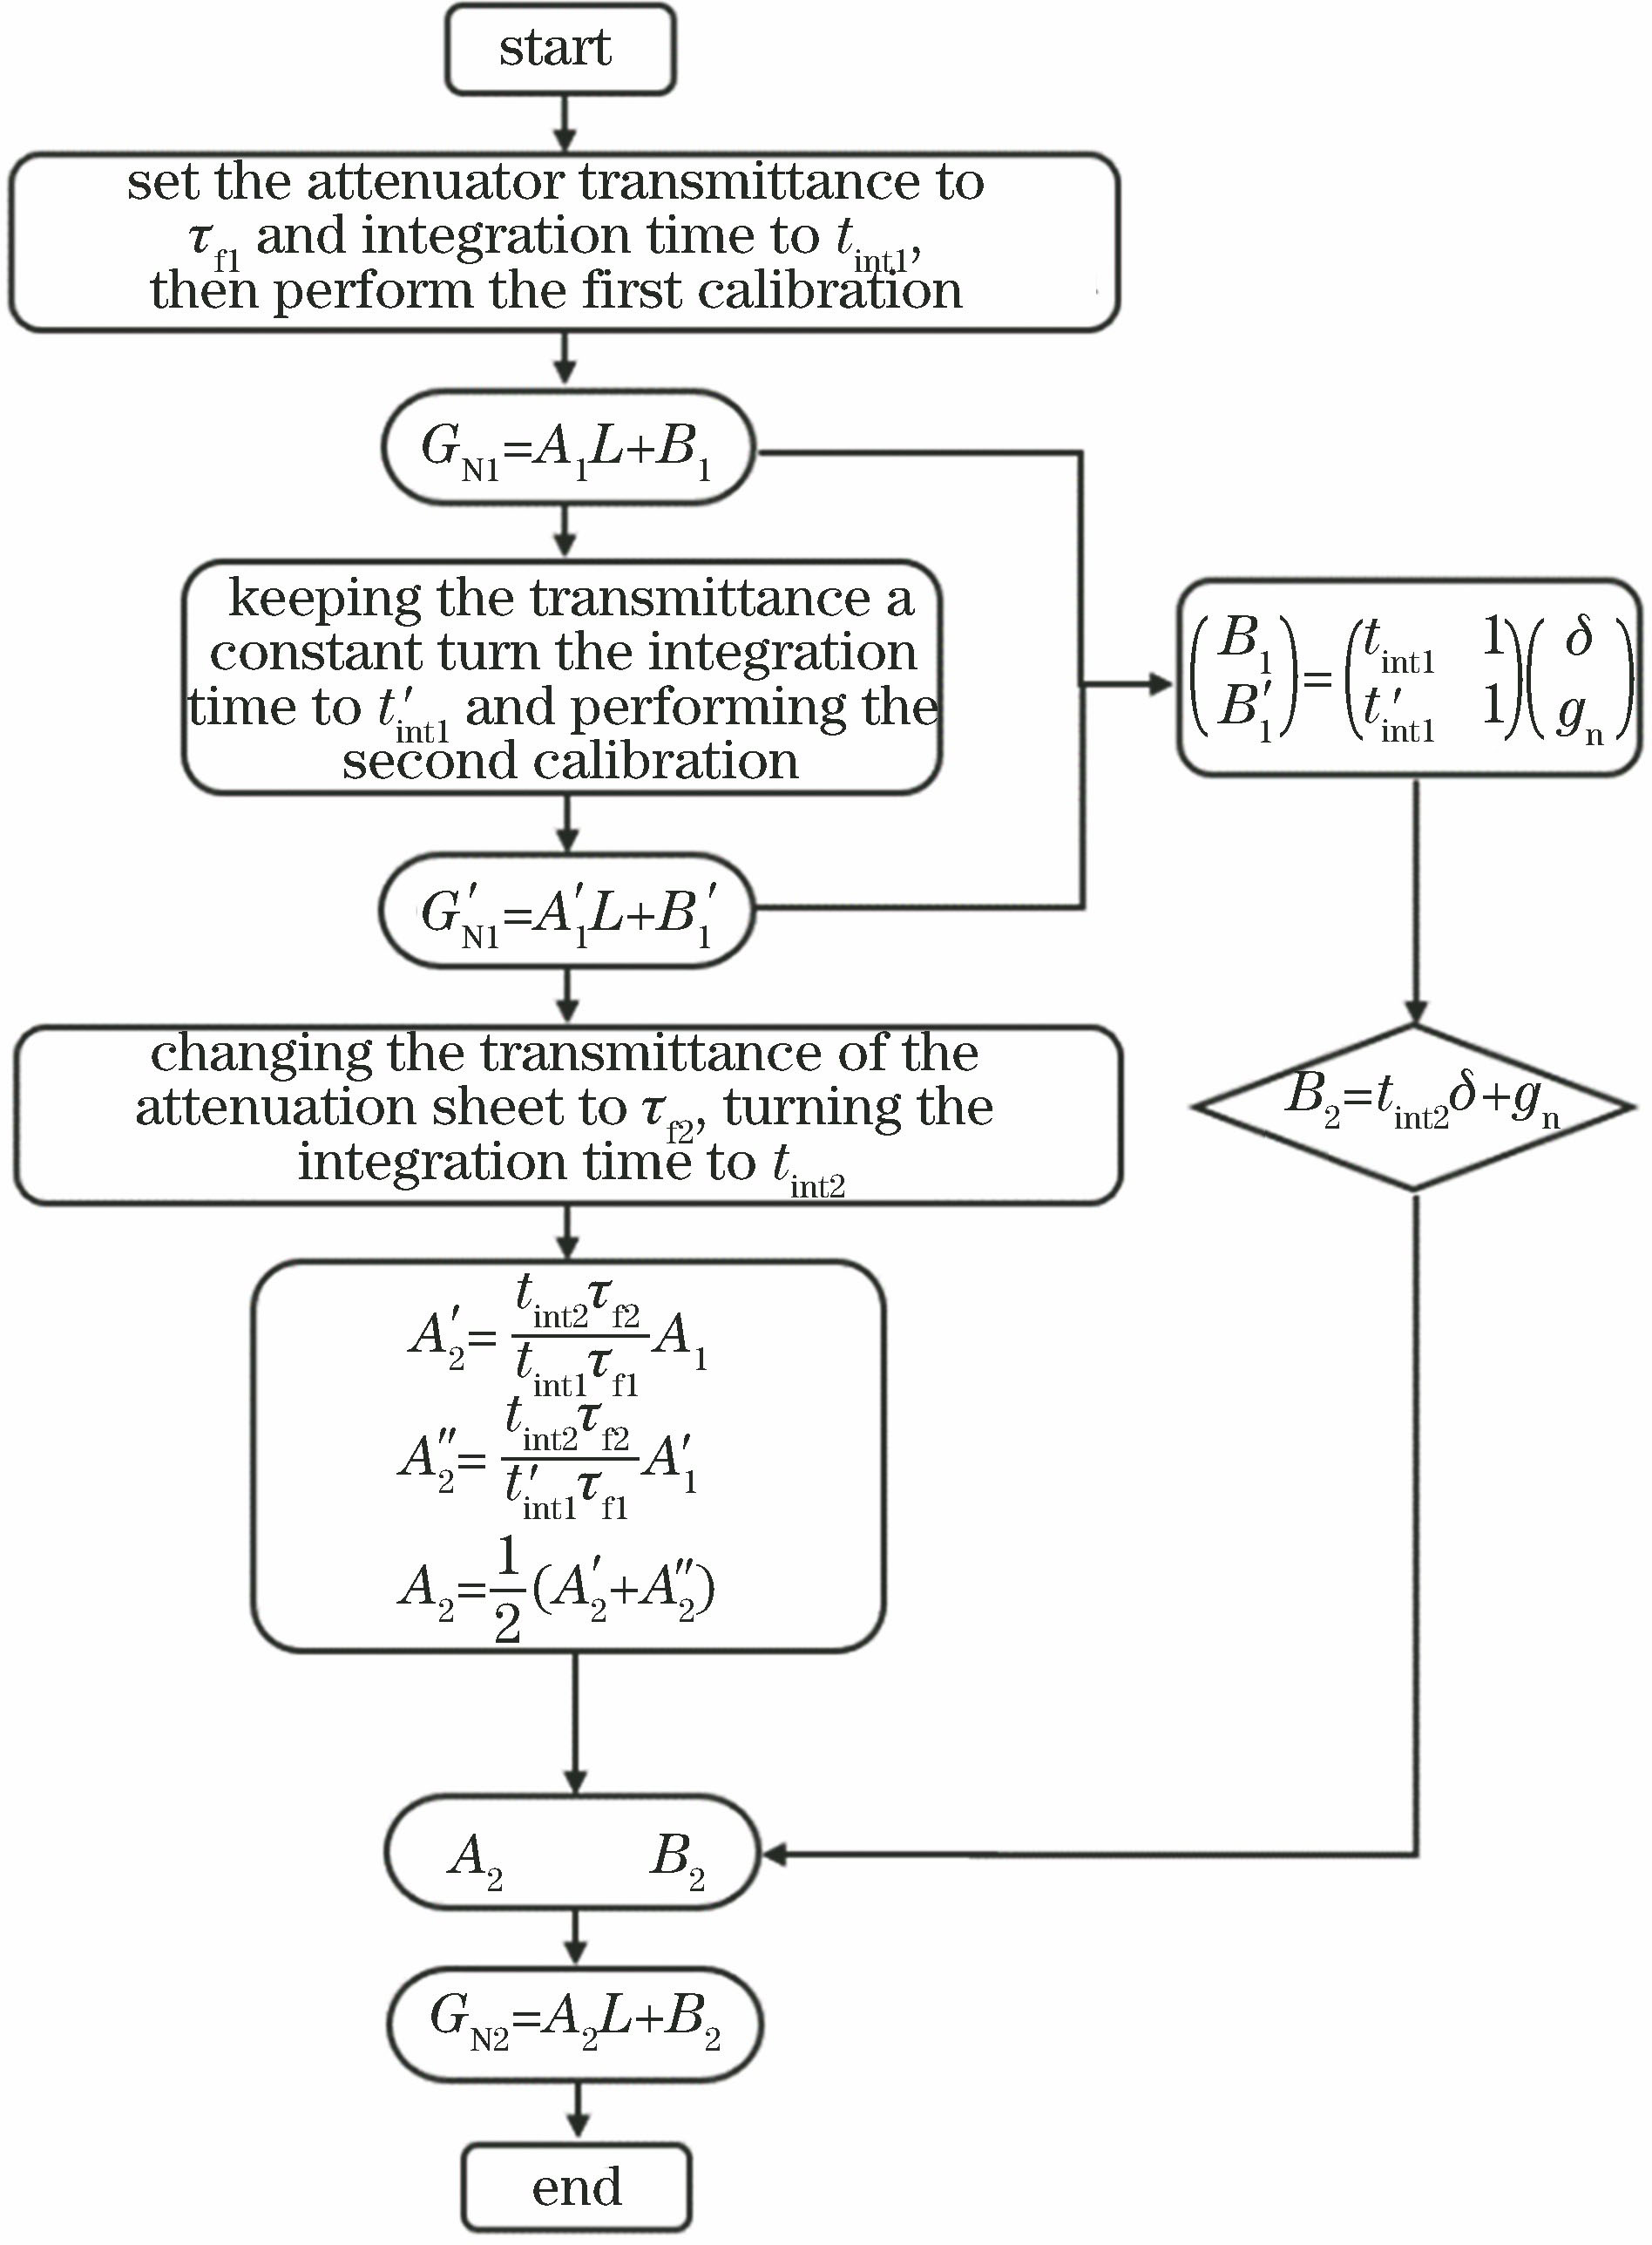
Fig. 2. Flow chart of simplified calibration method
Fig. 3. Schematic of calibration system
Fig. 4. Experimental image and spectral response parameters of detector. (a) Calibration image; (b) relative spectral response
Fig. 5. Error between actual and theoretical calculation values. (a) Attenuator with transmittance of 0.0740%; (b) attenuator with transmittance of 0.8193%
Fig. 6. Relative errors of inversion temperature and radiance of calibration models for different attenuators. (a) 0.8 ms; (b) 1 ms; (c) radiance (τf=0.0740%); (d) temperature (τf=0.0740%); (e) radiance(τf=0.8193%); (f) temperature (τf=0. 0.8193%)
| Gray value | Relative error /%(gray value) | Inversion radiance L /(W·m-2·Sr-1) | Relative error of inversion radiance /% | Inversion temperature T /℃ | Relative error of inversion temperature /% |
|---|
| 923.28 | -1.41 | 259.22 | -2.21 | 302.11 | -0.70 | | 1288.62 | -3.25 | 426.72 | -4.49 | 355.61 | -1.60 | | 1773.38 | -4.50 | 649.10 | -5.76 | 408.52 | -2.13 | | 2385.87 | -4.38 | 919.45 | -5.30 | 459.34 | -2.07 | | 3130.61 | -4.49 | 1251.02 | -5.24 | 510.71 | -2.14 | | 4008.92 | -4.15 | 1634.27 | -4.71 | 561.19 | -2.03 | | 5019.64 | -3.89 | 2074.93 | -4.32 | 611.80 | -1.97 | | 6159.72 | -3.41 | 2563.92 | -3.72 | 661.76 | -1.81 | | 7424.77 | -3.02 | 3105.85 | -3.26 | 711.83 | -1.69 |
|
Table 1. 2 Inversion results and relative error of calibration model at integration time of 0.2 ms after placing attenuator with transmittance of 0.8193%
| Gray value | L(0.8 ms) /(W·m-2·Sr-1) | T(0.8 ms) /℃ | L(1 ms) /(W·m-2·Sr-1) | T(1 ms) /℃ |
|---|
| 0.8 ms | 1 ms |
|---|
| 1499.72 | 1847.79 | 607.51 | 398.65 | 612.36 | 399.70 | | 1990.44 | 2461.21 | 1199.81 | 501.61 | 1204.73 | 502.32 | | 2673.44 | 3314.98 | 2008.67 | 602.16 | 2013.38 | 602.67 | | 3543.04 | 4402.00 | 3034.78 | 702.40 | 3038.53 | 702.73 | | 4585.58 | 5705.20 | 4238.37 | 800.69 | 4244.03 | 801.12 | | 5784.06 | 7203.34 | 5610.39 | 898.45 | 5614.45 | 898.72 |
|
Table 1. 0 Inversion results of calibration model at different integration time after placing attenuator with transmittance of 0.0740%
| Temperature /℃ | Lb /(W·m-2·Sr-1) | Relative error of inversion radiance /% | Relative error of inversion temperature /% | |
|---|
| 0.8 ms | 1.0 ms | 0.8 ms | 1.0 ms |
|---|
| 400 | 613.74 | 1.01 | 0.22 | 0.34 | 0.07 | | 500 | 1188.69 | -0.94 | -1.35 | -0.32 | -0.46 | | 600 | 1988.92 | -0.99 | -1.23 | -0.36 | -0.45 | | 700 | 3007.78 | -0.90 | -1.02 | -0.34 | -0.39 | | 800 | 4229.26 | -0.22 | -0.35 | -0.09 | -0.14 | | 900 | 5633.46 | 0.41 | 0.34 | 0.17 | 0.14 |
|
Table 1. 1 Relative error of inversion radiance and inversion temperature
| Temperature /℃ | Lb /(W·m-2·Sr-1) | GN(0.8 ms) | GN(1 ms) |
|---|
| 300 | 253.61 | 1045.78 | 1281.57 | | 400 | 613.74 | 1169.13 | 1436.49 | | 500 | 1188.69 | 1359.49 | 1673.39 | | 600 | 1988.92 | 1621.32 | 2001.71 | | 700 | 3007.78 | 1949.87 | 2413.85 | | 800 | 4229.26 | 2335.99 | 2865.68 | | 900 | 5633.46 | 2781.38 | 3450.40 | | 1000 | 7199.81 | 3277.95 | 4072.91 |
|
Table 1. Gray value responses of attenuator with transmittance of 0.0278% at different integration time
| Temperature /℃ | Integration time /ms | Fitting equation | R-square |
|---|
| From 300 ℃ to 1000℃ with a gradient of 100 ℃ | 0.8 | GN=0.3207Lb+975.9 | 0.9999 | | 1.0 | GN=0.4001Lb+1193 | 0.9999 |
|
Table 2. Fitting model of attenuator with transmission of 0.0278% at different integration time
| Integration time /ms | A1 | tint1 /ms | tint2 /ms | tint2/tint1 | τf2/τf1 | A2 | Average value |
|---|
| 0.8 | 0.3207 | 0.8 | 0.8 | 1.00 | 2.664 | 0.8543 | 0.8535 | | 0.4001 | 1.0 | 0.8 | 0.80 | 2.664 | 0.8527 | | | 1.0 | 0.3207 | 0.8 | 1.0 | 1.25 | 2.664 | 1.0679 | 1.0669 | | 0.4001 | 1.0 | 1.0 | 1.00 | 2.664 | 1.0659 | |
|
Table 3. Linear coefficients of calibration model for attenuator with transmittance of 0.0740% at integration time of 0.8 ms and 1.0 ms
| Integration time /ms | A1 | tint1 /ms | tint2 /ms | tint2/tint1 | τf2/τf1 | A2 | Averagevalue |
|---|
| 0.2 | 0.3207 | 0.8 | 0.2 | 0.25 | 29.472 | 2.3629 | 2.3606 | | 0.4001 | 1.0 | 0.2 | 0.20 | 29.472 | 2.3583 | |
|
Table 4. Linear coefficients of calibration model for attenuator with transmittance of 0.8193% at integration time of 0.2 ms
| Integration time /ms | Fitting equation |
|---|
| 0.8 | GN=0.8535Lb+975.9 | | 1.0 | GN=1.0669Lb+1193 |
|
Table 5. Fitting model of attenuator with transmittance of 0.074% at different integration time
| Integration time /ms | Fitting equation | Saturated radiance /(W·m-2·Sr-1) | Saturated temperature /℃ |
|---|
| 0.8 | GN=0.8535Lb+975.9 | 10807.38 | 1203.42 | | 1.0 | GN=1.0669Lb+1193 | 8442.22 | 1073.45 |
|
Table 6. Theoretical temperature measurement limit of calibration model for attenuator with transmittance of 0.0740%
| Integration time /ms | Fitting equation | Saturated radiance /(W·m-2·Sr-1) | Saturated temperature /℃ |
|---|
| 0.2 | GN=2.3606Lb+324.6 | 4183.43 | 796.51 |
|
Table 7. Theoretical temperature measurement limit of calibration model for attenuator with transmittance of 0.8193%
| Temperature /℃ | Lb /(W·m-2·Sr-1) | GN(0.8 ms) | GN(1 ms) |
|---|
| 400 | 613.74 | 1494.41 | 1846.33 | | 500 | 1188.69 | 1999.94 | 2478.33 | | 600 | 1988.92 | 2690.30 | 3041.07 | | 700 | 3007.78 | 3566.08 | 4434.81 | | 800 | 4229.26 | 4593.35 | 5720.96 | | 900 | 5633.46 | 5764.37 | 7183.06 |
|
Table 8. Gray value responses of attenuator with transmittance of 0.0740% at different integration time
| Temperature /℃ | Lb /(W·m-2·Sr-1) | GN(0.2 ms) |
|---|
| 300 | 253.61 | 936.50 | | 350 | 408.38 | 1331.93 | | 400 | 613.74 | 1856.87 | | 450 | 873.20 | 2495.05 | | 500 | 1188.69 | 3277.75 | | 550 | 1560.76 | 4182.47 | | 600 | 1988.92 | 5222.68 | | 650 | 2471.88 | 6376.99 | | 700 | 3007.78 | 7656.27 |
|
Table 9. Gray value responses of attenuator with transmittance of 0.8193% at integration time of 0.2 ms