
Jong-Moo Lee, Alessio Baldazzi, Matteo Sanna, Stefano Azzini, Joon Tae Ahn, Myung-Lae Lee, Youngik Sohn, Lorenzo Pavesi, "Do different kinds of photon-pair sources have the same indistinguishability in quantum silicon photonics?," Photonics Res. 11, 1820 (2023)
- Photonics Research
- Vol. 11, Issue 11, 1820 (2023)
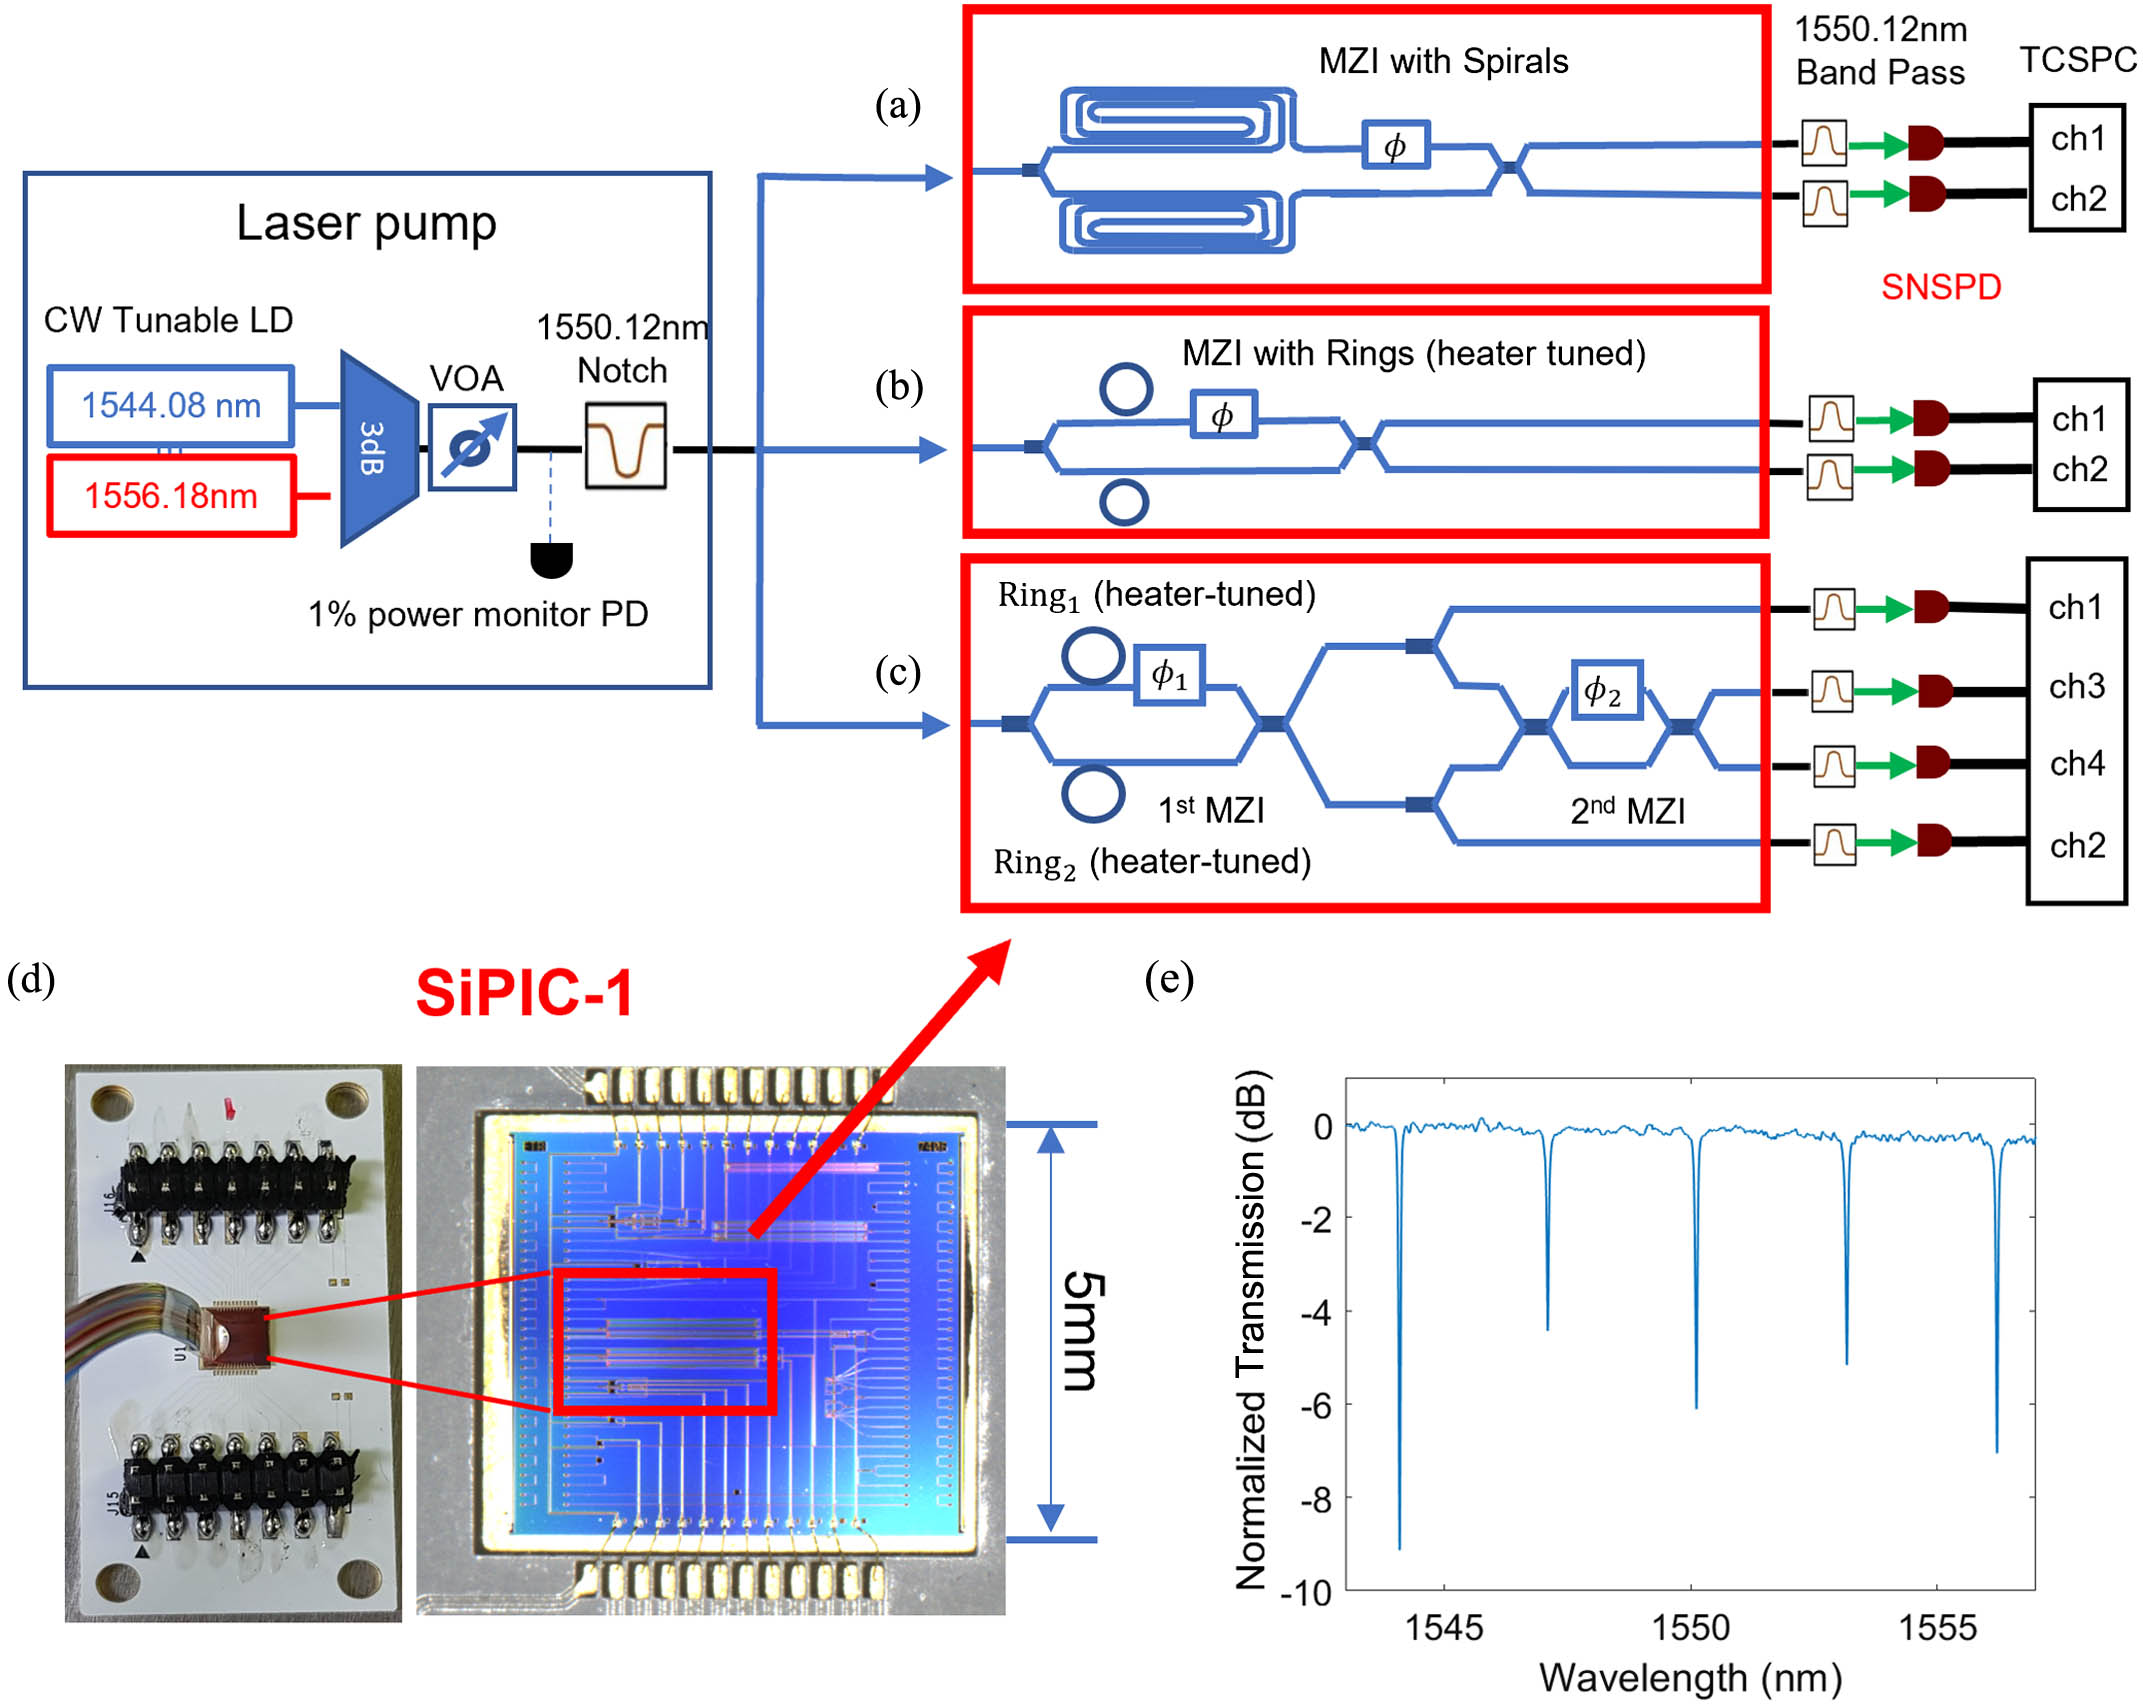
Fig. 1. (top) Experimental set-up to measure photon-pair generation and multi-source quantum interference in SiPIC-1. The blue rectangle contains the pump laser’s apparatus. The thick blue lines with arrows represent the fibers coupling the pump beams to the SiPIC, which is represented by the different circuits enclosed by the red rectangles. The circuit in (a) represents the photon-pair sources based on spiral waveguides that form the two arms of an MZI. The circuit in (b) represents the photon-pair sources formed by the microrings. The circuit in (c) represents the composite photon-pair sources based on both waveguides and microrings. These are followed by a second MZI to measure the quantum interference of the generated photons. On the right, the detection channels (ch 1–ch 4) are represented. These are based on a sequence of optical fibers, band-pass filters, superconductor nanowire single photon detectors (SNSPDs), and a time-correlated single photon counting module interfaced to a computer for further processing. (d) On the left is the photograph of the packaged SiPIC-1 chip. On the right is the zoomed-in image of the chip with the circuit highlighted by the red rectangle. (e) The normalized transmission spectrum of the circuit in (b) when the two microring resonators are tuned in resonance with the pump photons wavelengths.

Fig. 2. Experimental set-up to measure photon-pair generation and multi-source quantum interference in SiPIC-2. The blue rectangle contains the pump laser’s apparatus. The red rectangle contains a scheme of the SiPIC. Four photodiodes (PD 1 – PD 4 1 ) are used to measure the output coincidence counts. (b) On the left is the photograph of the packaged SiPIC-2 chip. On the right is the zoomed-in image of the chip with the circuit highlighted by the red rectangle. (c) The normalized transmission spectra measured by the different photodiodes (blue line PD 1 PD 2 PD 3 PD 4
Fig. 3. Measurement results of the characteristics of the photon-pair sources in the circuits shown in spirals [Fig. 1 (a)] and rings [Fig. 1 (b)]. (a) Coincidence to accidental ratio as a function of the pump power coupled to the chip (blue dots refer to the spirals, empty red dots to the rings), and heralding rate as a function of the coupled pump power (violet dots refer to spirals, empty violet dots to microrings). (b) g h ( 2 ) ( 0 )
Fig. 4. Measurements of the characteristics of the photon-pair sources in the circuit shown in Fig. 1 (c). (a) The coincidence to the accidental ratio as a function of the pump power coupled to the chip (blue dots refer to the RingOff mode, i.e., the microrings are off-resonant with the pump photons wavelengths; the empty red dots refer to the RingOn mode, and the microrings are resonant with the pump photons wavelengths), and heralding rate as a function of the coupled pump power (violet dots refer to RingOff, empty violet dots to RingOn). (b) g h ( 2 ) ( 0 )
Fig. 5. Measurements of the characteristics of the photon-pair sources in SiPIC-2. The coincidence to the accidental ratio as a function of the pump power coupled to the chip (blue dots refer to the RingOff mode, i.e., the microrings are off-resonant with the pump photons wavelengths; empty red dots refer to the RingOn mode, i.e., the microrings are resonant with the pump photons wavelengths), and the heralding rate as a function of the coupled pump power (violet dots refer to RingOff, empty violet dots to RingOn).
Fig. 6. (a) Measured classical transmissions from the two outputs (blue dots ch1, red dots ch2) of the MZI in Fig. 1 (a) (SiPIC-1) as a function of the phase ϕ ϕ
Fig. 7. (a) Classical light transmissions at the outputs of the two channels of the second MZI in the circuit of Fig. 1 (c) (SiPIC-1) as a function of the phase ϕ 2 ϕ 2 ϕ 2
Fig. 8. Coincidence rates between the output channels of the second MZI in the SiPIC-2 device [Fig. 2 (a)] as a function of phase ϕ 2
Fig. 9. Simulated JSI as a function of the signal (λ s λ i Q 1.5 × 10 4 Q 3 × 10 4 1 and 2 .
Fig. 10. Scheme presented in Fig. 1 (a). Its division into 5 parts is beneficial for its analytical description.
Fig. 11. Chip design shown in Fig. 1 (c) is displayed. It is divided into 7 parts for simplicity of discussion.
Fig. 12. (a) Simulated JSA overlaps as a function of the variations of L eff Q
|
Table 1. Summary of the Relevant Properties of the Photon-Pair Sources in SiPIC-1 and SiPIC-2


Set citation alerts for the article
Please enter your email address

© Copyright 2018-2021 | Chinese Laser Press. All Rights Reserved 沪ICP备15018463号-20