• Spectroscopy and Spectral Analysis
  • Vol. 42, Issue 2, 517 (2022)
Dan-ping WEI* and Guang-hui ZHENG*;
Author Affiliations
  • School of Geographical Sciences, Nanjing University of Information Science & Technology, Nanjing 210044, China
  • show less
    DOI: 10.3964/j.issn.1000-0593(2022)02-0517-07 Cite this Article
    Dan-ping WEI, Guang-hui ZHENG. Estimation of Soil Total Phosphorus Content in Coastal Areas Based on Hyperspectral Reflectance[J]. Spectroscopy and Spectral Analysis, 2022, 42(2): 517 Copy Citation Text show less
    Sampleing location
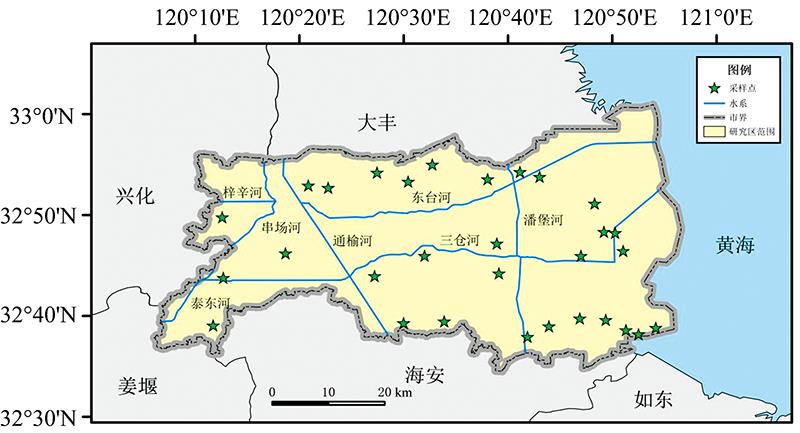
    Fig. 1. Sampleing location
    Scatter plot of determination coefficients for partial least square regression calibration and prediction
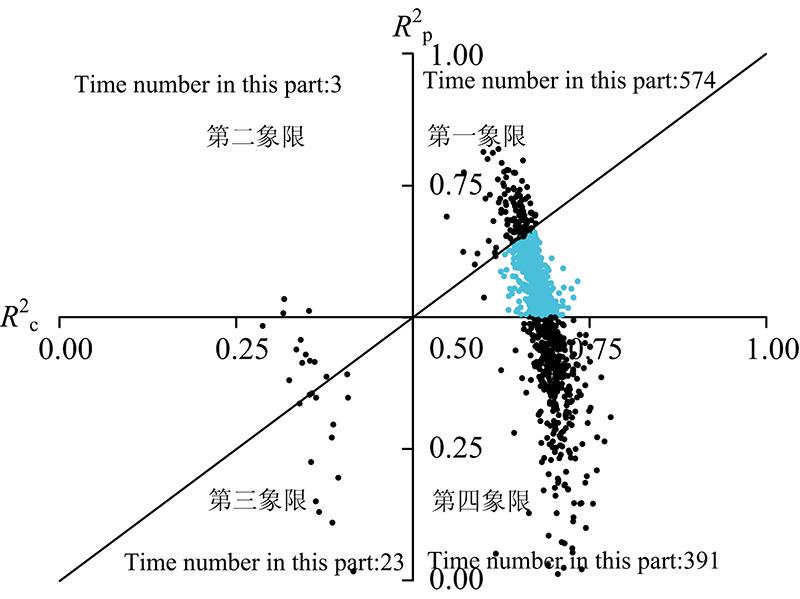
    Fig. 2. Scatter plot of determination coefficients for partial least square regression calibration and prediction
    土壤属性最大值/
    (g·kg-1)
    最小值/
    (g·kg-1)
    平均值/
    (g·kg-1)
    标准差/
    (g·kg-1)
    变异系数/
    %
    峰值K偏度S
    TP1.300.220.680.1928.021.012.19
    SOM52.561.399.188.7495.216.720.61
    Table 1. Statistics of soil TP and SOM contents
    统计参数RSNVMSCFDSDRLCR
    建模集预测集建模集预测集建模集预测集建模集预测集建模集预测集建模集预测集建模集预测集
    最小值/(g·kg-1)0.220.460.220.510.220.510.220.470.220.440.220.500.220.46
    最大值/(g·kg-1)1.301.281.301.141.301.141.301.141.301.141.301.281.301.14
    平均值/(g·kg-1)0.670.760.680.720.680.720.680.720.690.670.670.740.680.71
    标准差/(g·kg-1)0.190.170.200.130.200.130.200.130.200.170.200.170.200.16
    变异系数/%29.1122.1930.2617.9930.2617.9930.1618.6328.8325.1529.3322.3629.4822.43
    Table 2. Sample set partitioning based on KS
    统计参数RSNVMSCFDSDRLCR
    建模集预测集建模集预测集建模集预测集建模集预测集建模集预测集建模集预测集建模集预测集
    最小值/(g·kg-1)0.220.490.220.450.220.450.220.500.220.470.220.490.220.46
    最大值/(g·kg-1)1.300.841.300.841.300.831.300.831.300.841.300.841.301.08
    平均值/(g·kg-1)0.690.680.680.700.680.700.680.720.690.660.690.680.680.69
    标准差/(g·kg-1)0.210.130.210.110.210.110.210.100.210.120.210.120.200.14
    变异系数/%30.0118.6130.5815.5730.5715.6730.8913.5029.9117.8230.0918.0729.8320.20
    Table 3. Sample set partitioning based on SPXP
    Partitioning
    methods
    RMSEcRc2RMSEpRp2RPDLVs
    Min0.090.290.070.011.023
    RSMax0.160.780.190.822.4013
    Mean0.110.670.130.511.499.14
    KS0.110.670.130.421.349
    SPXY0.110.690.110.261.199
    Table 4. Statistics of partial least square regression
    Partitioning
    methods
    RMSEcRc2RMSEpRp2RPD
    Min0.060.730.100.000.86
    RSMax0.110.920.270.611.42
    Mean0.090.840.170.201.11
    KS0.110.800.160.411.09
    SPXY0.100.830.090.461.38
    Table 5. Statistics of support vector machine
    光谱变换RSKSSPXY
    Rc2Rp2LVsRc2Rp2LVsRc2Rp2LVs
    R0.670.509.130.670.4290.690.269
    SNV0.640.477.120.670.2870.630.236
    MSC0.660.487.940.680.2980.670.338
    FD0.630.464.380.700.3360.71-0.406
    SD0.680.445.010.680.4650.680.275
    RL0.670.488.530.660.5990.700.129
    CR0.610.484.930.590.3540.580.494
    Table 6. PLSR calibration and prediction results of different spectral transformation methods and sample-set partitioning methods
    光谱变换RSKSSPXY
    Rc2Rp2Rc2Rp2Rc2Rp2
    R0.840.200.800.410.830.46
    SNV0.890.370.890.550.840.49
    MSC0.890.370.890.560.880.79
    FD0.910.460.920.820.930.76
    SD0.900.430.900.450.920.78
    RL0.850.210.800.310.840.49
    CR0.900.440.900.690.900.71
    Table 7. SVM calibration and prediction results of different spectral transformation methods and sample-set partitioning methods
    Dan-ping WEI, Guang-hui ZHENG. Estimation of Soil Total Phosphorus Content in Coastal Areas Based on Hyperspectral Reflectance[J]. Spectroscopy and Spectral Analysis, 2022, 42(2): 517
    Download Citation