
Quan Zhang, Junjie Yu, Biran Shi, Fanchun Tang, Jianlang Li. LG11-mode vortex Nd:YAG laser by applying second-order circular Dammann grating for annular pumping[J]. Chinese Optics Letters, 2019, 17(5): 051402
- Chinese Optics Letters
- Vol. 17, Issue 5, 051402 (2019)
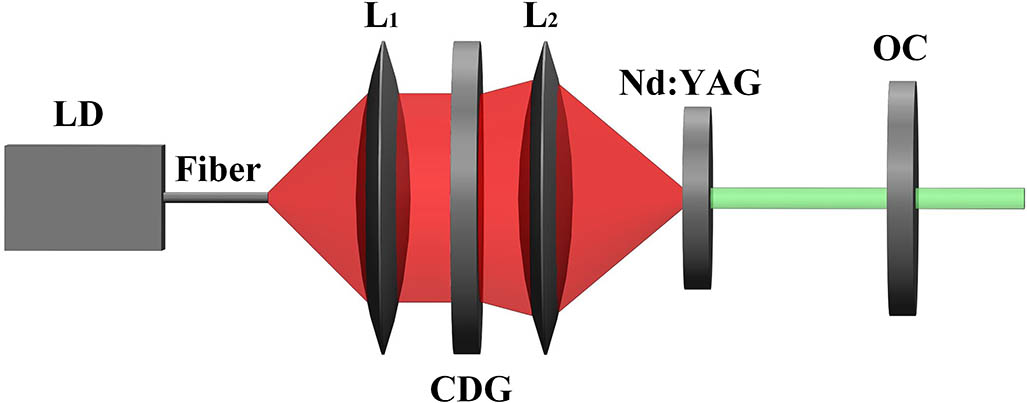
Fig. 1. Schematic diagram of an end-pumped laser involving a CDG in the pumping unit.
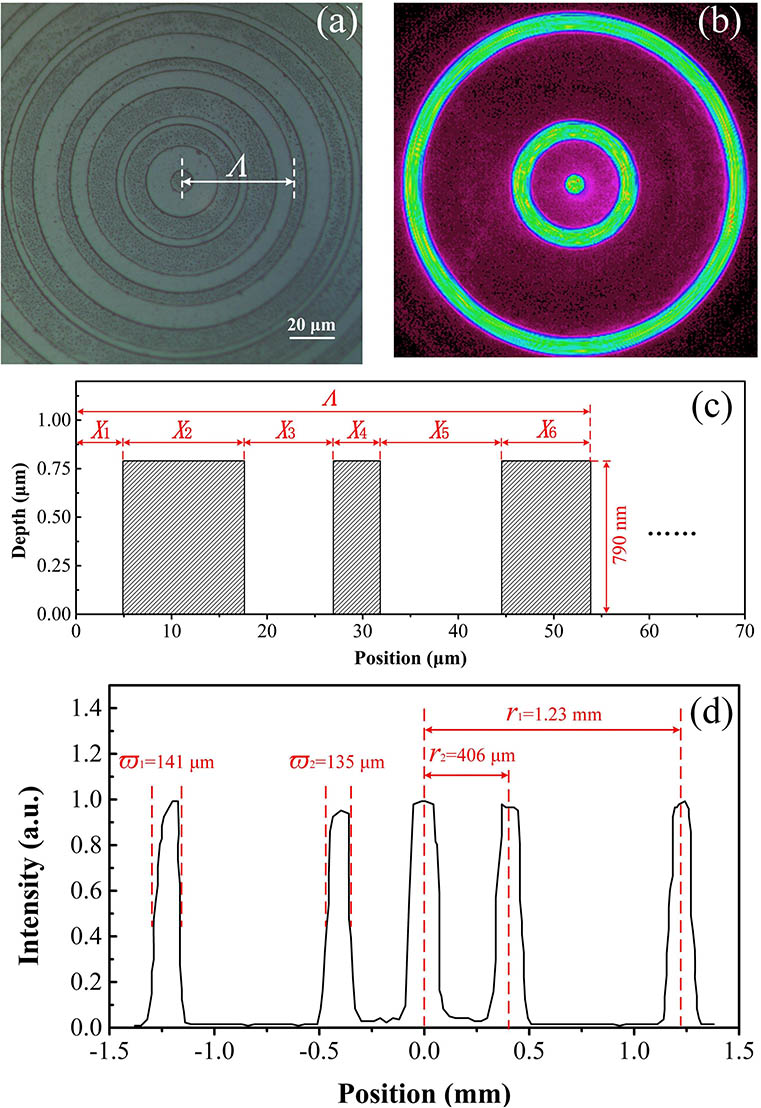
Fig. 2. (a) Top view of second-order CDG taken by microscopy, where the bright rings indicate the ridges, and the dark ones represent the grooves, (b) transverse intensity distribution of diffracted pump light at the far field, (c) schematic cross section of the CDG along the radial direction, and (d) the line profile of pump light along the radial direction.
Fig. 3. Variation of output power of the laser with pump power.
Fig. 4. Intensity distributions of double-ring modes obtained at different pump powers: (a)
Fig. 5. Measured and theoretical intensity distribution of the laser mode along the horizontal direction at
Fig. 6. Evolution of beam waist of the laser mode at
Fig. 7. Schematic diagram of the Mach–Zehnder interferometer for phase detection. NPBS, non-polarized beam splitter.
Fig. 8. Captured interference patterns of the double-ring mode at
Fig. 9. Variation of output power of the laser with pump power.
Fig. 10. Intensity distributions of single-ring modes obtained at different pump powers: (a)
Fig. 11. Measured and theoretical intensity distribution of the laser mode along the horizontal direction at
Fig. 12. Evolution of the beam waist of the laser mode at
Fig. 13. Captured interference patterns of the single-ring mode at

Set citation alerts for the article
Please enter your email address
© Copyright 2018-2021 | Chinese Laser Press. All Rights Reserved 沪ICP备15018463号-20