• Laser & Optoelectronics Progress
  • Vol. 56, Issue 2, 021101 (2019)
Dongyu Xu1, Xiaorun Li1、*, Liaoying Zhao2, Rui Shu3, and Qijia Tang3
Author Affiliations
  • 1 College of Electrical Engineering, Zhejiang University, Hangzhou, Zhejiang 310027, China
  • 2 Institute of Computer Application Technology, Hangzhou Dianzi University, Hangzhou, Zhejiang 310018, China
  • 3 Shanghai Institute of Satellite Engineering, Shanghai 200240, China
  • show less
    DOI: 10.3788/LOP56.021101 Cite this Article Set citation alerts
    Dongyu Xu, Xiaorun Li, Liaoying Zhao, Rui Shu, Qijia Tang. Hyperspectral Image Quality Evaluation Based on Multi-Model Fusion[J]. Laser & Optoelectronics Progress, 2019, 56(2): 021101 Copy Citation Text show less
    Scene images with features of cloud-only. (a) Sample A; (b) sample B; (c) sample C; (d) sample D; (e) sample E; (f) sample F
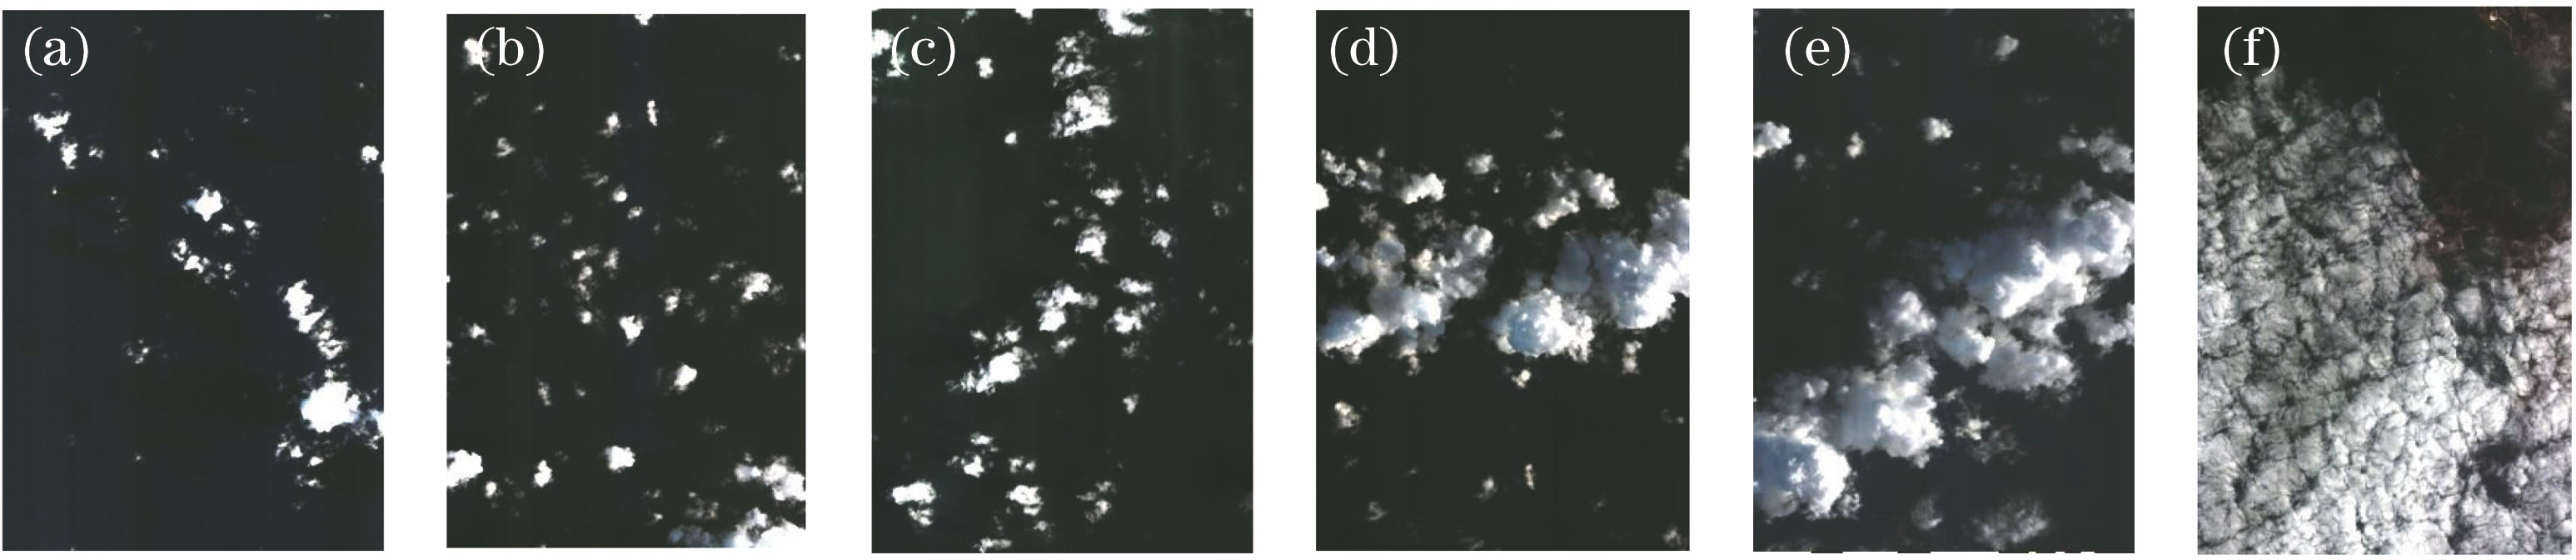
    Fig. 1. Scene images with features of cloud-only. (a) Sample A; (b) sample B; (c) sample C; (d) sample D; (e) sample E; (f) sample F
    Scene images with features of land and sea. (a) Sample G; (b) sample H; (c) sample I; (d) sample J
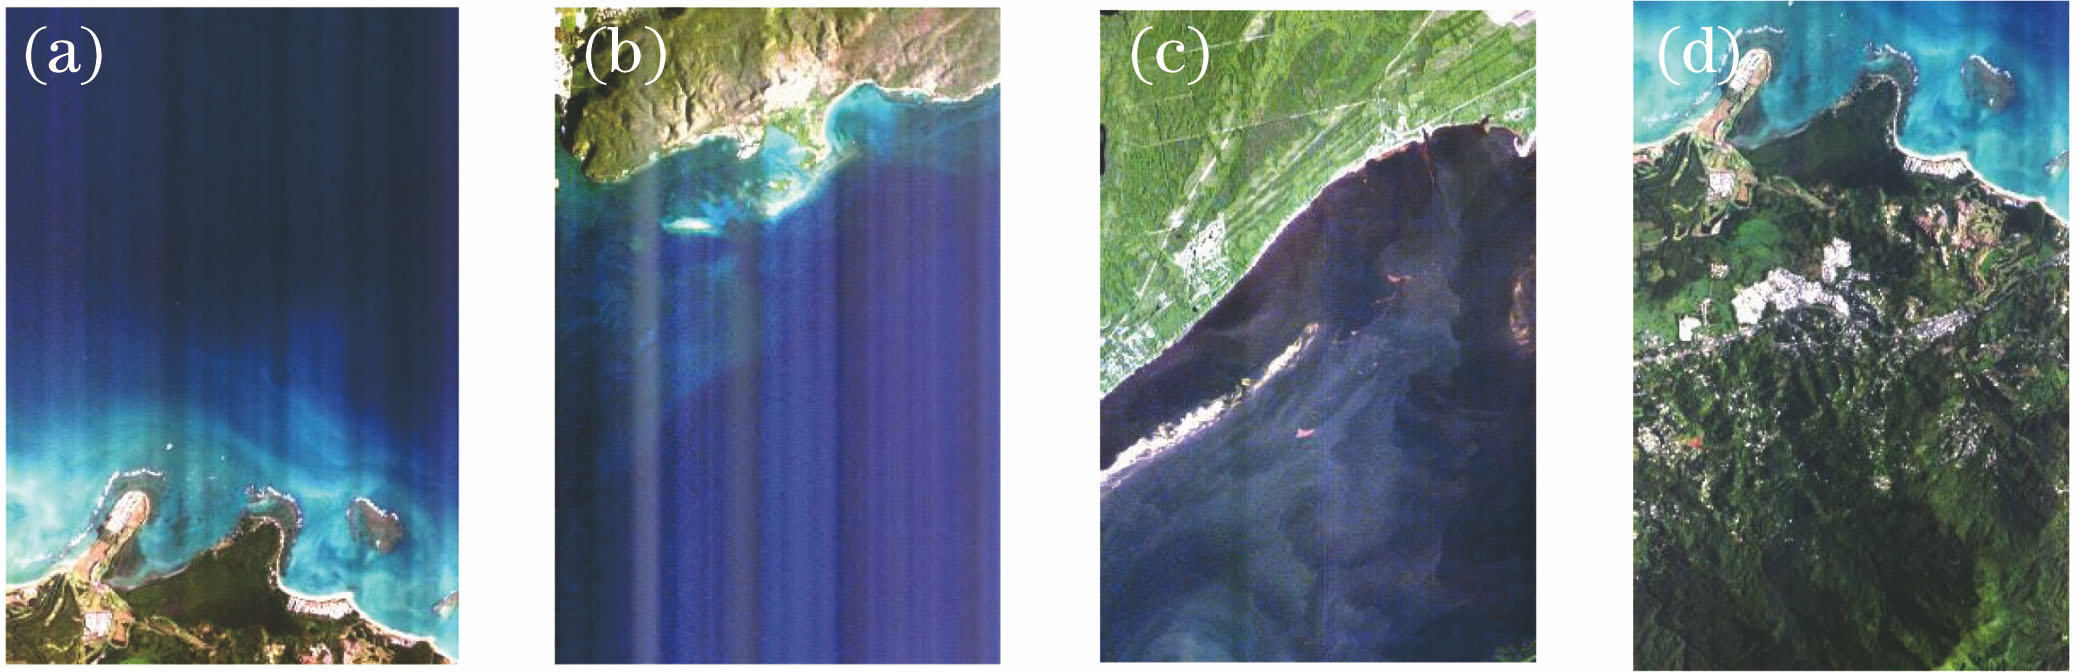
    Fig. 2. Scene images with features of land and sea. (a) Sample G; (b) sample H; (c) sample I; (d) sample J
    Scene images with features of land, sea and cloud. (a)Sample K; (b) sample L; (c) sample M
    Fig. 3. Scene images with features of land, sea and cloud. (a)Sample K; (b) sample L; (c) sample M
    Simulation images of degraded factors. (a) Simulation image of noise; (b) simulation image of ambiguity
    Fig. 4. Simulation images of degraded factors. (a) Simulation image of noise; (b) simulation image of ambiguity
    Flow chart of cloud content detection via hyperspectral remote sensing image
    Fig. 5. Flow chart of cloud content detection via hyperspectral remote sensing image
    Structural diagram of GRNN network
    Fig. 6. Structural diagram of GRNN network
    Structural diagram of multi-model fusion integrated quality evaluation model
    Fig. 7. Structural diagram of multi-model fusion integrated quality evaluation model
    Fitting results by various regression algorithms. (a) SVR; (b) Bagging; (c) model fusion; (d) GRNN
    Fig. 8. Fitting results by various regression algorithms. (a) SVR; (b) Bagging; (c) model fusion; (d) GRNN
    SampleImaging timeLocationType
    A2017-02-03Hong Kong, ChinaCloud
    B2016-09-06Japan IslandCloud
    C2017-04-23Caribbean SeaCloud
    D2017-02-03Hong Kong, ChinaCloud
    E2016-09-06Japan IslandCloud
    F2017-04-23Caribbean SeaCloud
    G2017-02-03Hong Kong, ChinaSea (basis), land
    H2016-09-06Japan IslandSea (basis), land
    I2017-04-23Caribbean SeaSea (basis), land
    J2017-02-03Hong Kong, ChinaSea, land (basis)
    K2016-09-06Japan IslandSea, land, cloud
    L2017-04-23Caribbean SeaSea, land, cloud
    M2017-02-03Hong Kong, ChinaSea, land, cloud
    Table 1. Details of feature scene images
    MethodTrainingtime /sTraining setTesting set
    Meansquare errorFittingindicator R2Classificationaccuracy /%Meansquare errorFittingindicator R2Classificationaccuracy /%
    GRNN14.3560.02070.993698.1570.58960.867995.333
    SVR3.5830.31480.940296.8130.78550.820994.667
    Bagging1.4970.18800.964395.8170.66270.854294.667
    Model fusion5.0190.02870.994598.0160.27960.959096.333
    Table 2. Comparison of results by regression algorithms
    Dongyu Xu, Xiaorun Li, Liaoying Zhao, Rui Shu, Qijia Tang. Hyperspectral Image Quality Evaluation Based on Multi-Model Fusion[J]. Laser & Optoelectronics Progress, 2019, 56(2): 021101
    Download Citation