• Photonics Research
  • Vol. 12, Issue 5, 932 (2024)
Heming Hu1, Yafang He1, Baisong Chen1, Ziming Wang1..., Yingzhi Li1, Qijie Xie2, Quanxin Na2, Zihao Zhi1, Xuetong Li1, Huan Qu1, Patrick Lo3 and Junfeng Song1,2,*|Show fewer author(s)
Author Affiliations
  • 1State Key Laboratory of Integrated Optoelectronics, College of Electronic Science and Engineering, Jilin University, Changchun 130012, China
  • 2Peng Cheng Laboratory, Shenzhen 518000, China
  • 3Advance Micro Foundry Pte. Ltd., Singapore 117685, Singapore
  • show less
    DOI: 10.1364/PRJ.515496 Cite this Article Set citation alerts
    Heming Hu, Yafang He, Baisong Chen, Ziming Wang, Yingzhi Li, Qijie Xie, Quanxin Na, Zihao Zhi, Xuetong Li, Huan Qu, Patrick Lo, Junfeng Song, "Silicon-based optical phased array with a reconfigurable aperture for “gaze” scanning of LiDAR," Photonics Res. 12, 932 (2024) Copy Citation Text show less
    (a) Optical microscope image of the variable aperture OPA. (b) Schematic of the variable aperture OPA. (c) Electrically and optically packaged variable aperture OPA chip with control circuit.
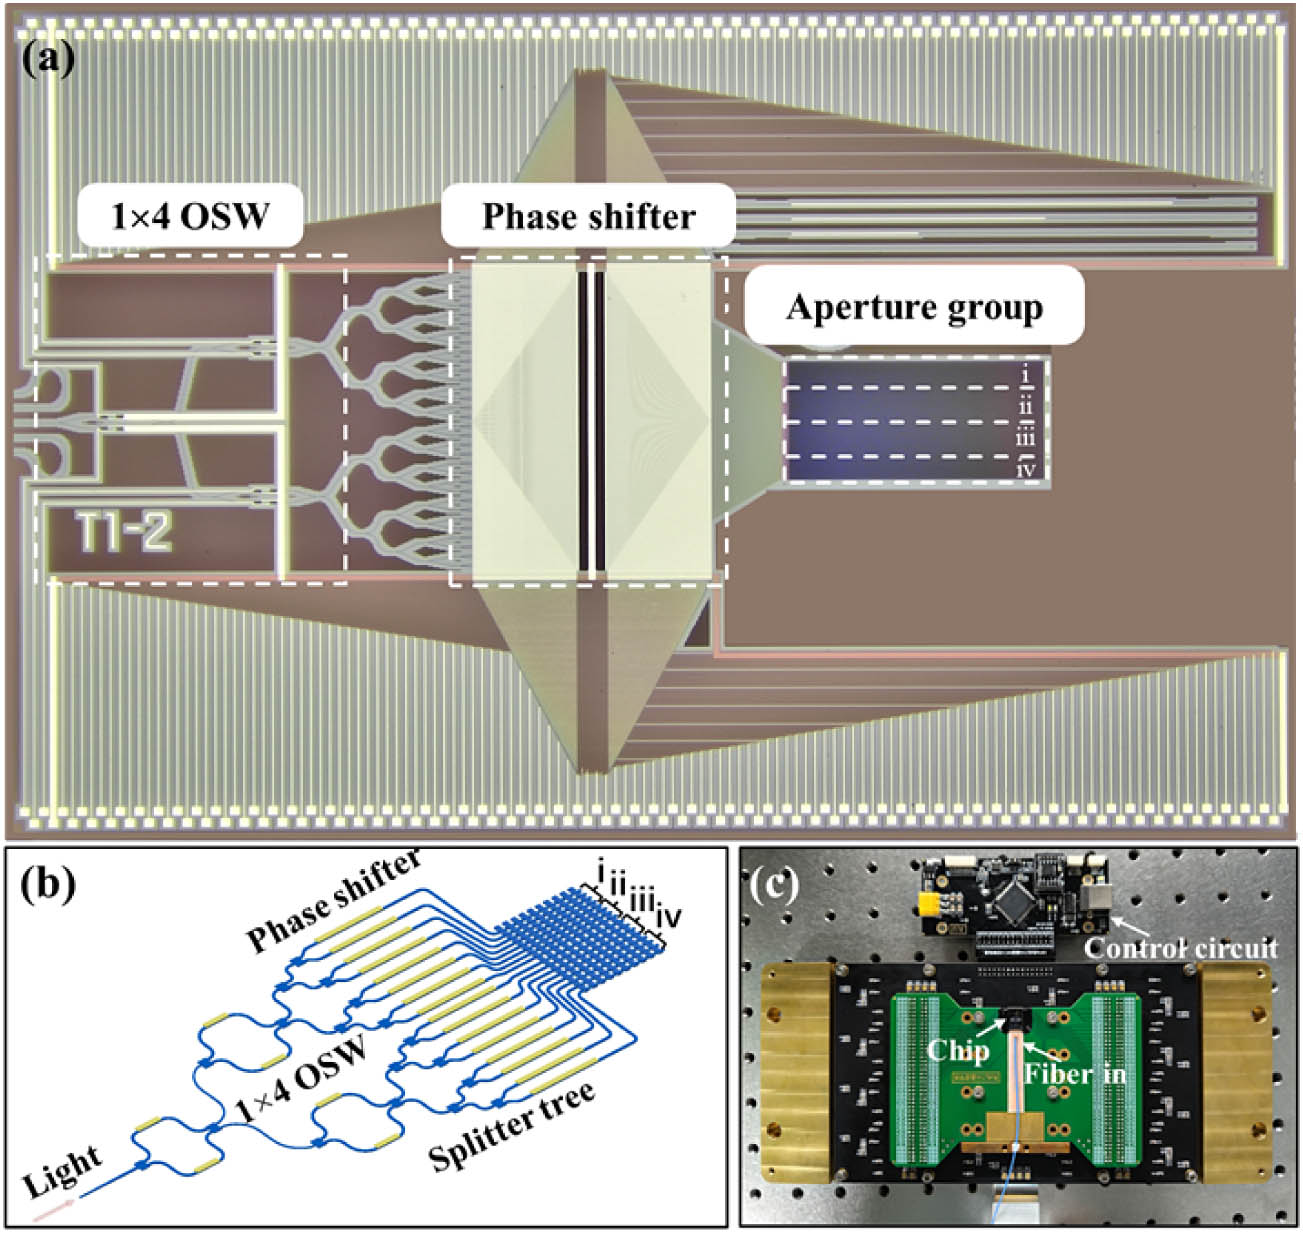
    Fig. 1. (a) Optical microscope image of the variable aperture OPA. (b) Schematic of the variable aperture OPA. (c) Electrically and optically packaged variable aperture OPA chip with control circuit.
    Schematic diagram of optical path distribution for OPA with (a) 64, (b) 128, (c) 192, and (d) 256 antennas.
    Fig. 2. Schematic diagram of optical path distribution for OPA with (a) 64, (b) 128, (c) 192, and (d) 256 antennas.
    Beam steering performance of (a) 64, (b) 128, (c) 192, and (d) 256 channels at 0°, ±5°, and ±10°; each contains a light spot picture captured by a near-infrared camera and intensity distribution along the cross section of the light spot.
    Fig. 3. Beam steering performance of (a) 64, (b) 128, (c) 192, and (d) 256 channels at 0°, ±5°, and ±10°; each contains a light spot picture captured by a near-infrared camera and intensity distribution along the cross section of the light spot.
    Main lobe divergence at 0° with different aperture scales.
    Fig. 4. Main lobe divergence at 0° with different aperture scales.
    (a) Power consumption required for steering under different apertures within the range of −10° to 10°; (b) average power consumption under different apertures.
    Fig. 5. (a) Power consumption required for steering under different apertures within the range of 10° to 10°; (b) average power consumption under different apertures.
    Configuring the voltage for (a) 64, (b) 128, (c) 192, and (d) 256 channels at the same time, and the turn-on time of the last channel.
    Fig. 6. Configuring the voltage for (a) 64, (b) 128, (c) 192, and (d) 256 channels at the same time, and the turn-on time of the last channel.
    Far-field distance for different apertures.
    Fig. 7. Far-field distance for different apertures.
    (a) Simulated formation process for light beams of 64-, 128-, 192-, and 256-channel OPA along with distance; (b) captured beam spot at the distance of 3 cm, 10 cm, and 20 cm.
    Fig. 8. (a) Simulated formation process for light beams of 64-, 128-, 192-, and 256-channel OPA along with distance; (b) captured beam spot at the distance of 3 cm, 10 cm, and 20 cm.
    Schematic diagram of gaze scanning using different apertures.
    Fig. 9. Schematic diagram of gaze scanning using different apertures.
    Sum of the normalized far-field spot obtained by the (a) 64-channel aperture and (b) 256-channel aperture steering with laser wavelength and phase shift.
    Fig. 10. Sum of the normalized far-field spot obtained by the (a) 64-channel aperture and (b) 256-channel aperture steering with laser wavelength and phase shift.
    (a) Picture of the letters JLU as a scanning target; (b) full-range scanning using 64-channel aperture; (c) gaze on the letters J, L, and U using 256-channel aperture.
    Fig. 11. (a) Picture of the letters JLU as a scanning target; (b) full-range scanning using 64-channel aperture; (c) gaze on the letters J, L, and U using 256-channel aperture.
    Schematic diagram of RA-OPA embedded FMCW LiDAR system.
    Fig. 12. Schematic diagram of RA-OPA embedded FMCW LiDAR system.
    (a) Picture of experimental setup. RF spectra for the beat signal in the cases of (b) 64-channel, (c) 128-channel, (d) 192-channel, and (e) 256-channel OPA at a distance of 2 m.
    Fig. 13. (a) Picture of experimental setup. RF spectra for the beat signal in the cases of (b) 64-channel, (c) 128-channel, (d) 192-channel, and (e) 256-channel OPA at a distance of 2 m.
    (a) Picture of targets placed in front of the OPA in different directions; (b) experimental result for a rough scan of the target by using 64-channel aperture; (c) experimental result for a fine scan of the target by using 256-channel aperture; (d) gaze at the corner of the target using 256-channel aperture; and (e) target position information obtained by splicing rough scan and gaze areas.
    Fig. 14. (a) Picture of targets placed in front of the OPA in different directions; (b) experimental result for a rough scan of the target by using 64-channel aperture; (c) experimental result for a fine scan of the target by using 256-channel aperture; (d) gaze at the corner of the target using 256-channel aperture; and (e) target position information obtained by splicing rough scan and gaze areas.
    Heming Hu, Yafang He, Baisong Chen, Ziming Wang, Yingzhi Li, Qijie Xie, Quanxin Na, Zihao Zhi, Xuetong Li, Huan Qu, Patrick Lo, Junfeng Song, "Silicon-based optical phased array with a reconfigurable aperture for “gaze” scanning of LiDAR," Photonics Res. 12, 932 (2024)
    Download Citation