Author Affiliations
1Key Laboratory of the Ministry of Education for Optoelectronic Measurement Technology and Instrument, Beijing Information Science and Technology University, Beijing 100192, China2Beijing Laboratory of Optical Fiber Sensing and System, Beijing Information Science and Technology University, Beijing 100016, China3School of Precision Instrument & Opto-Electronics Engineering, Tianjin University, Tianjin 300072, Chinashow less
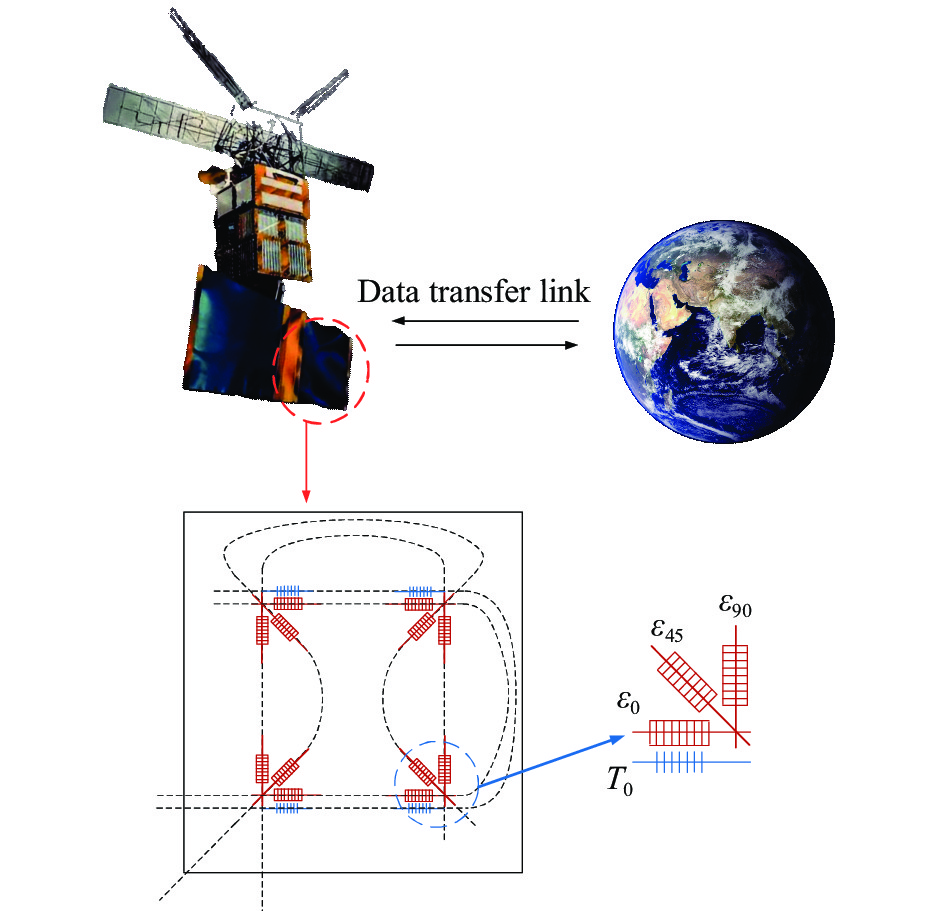
Fig. 1. FBG sensor network layout of remote sensing satellite active phased array antenna
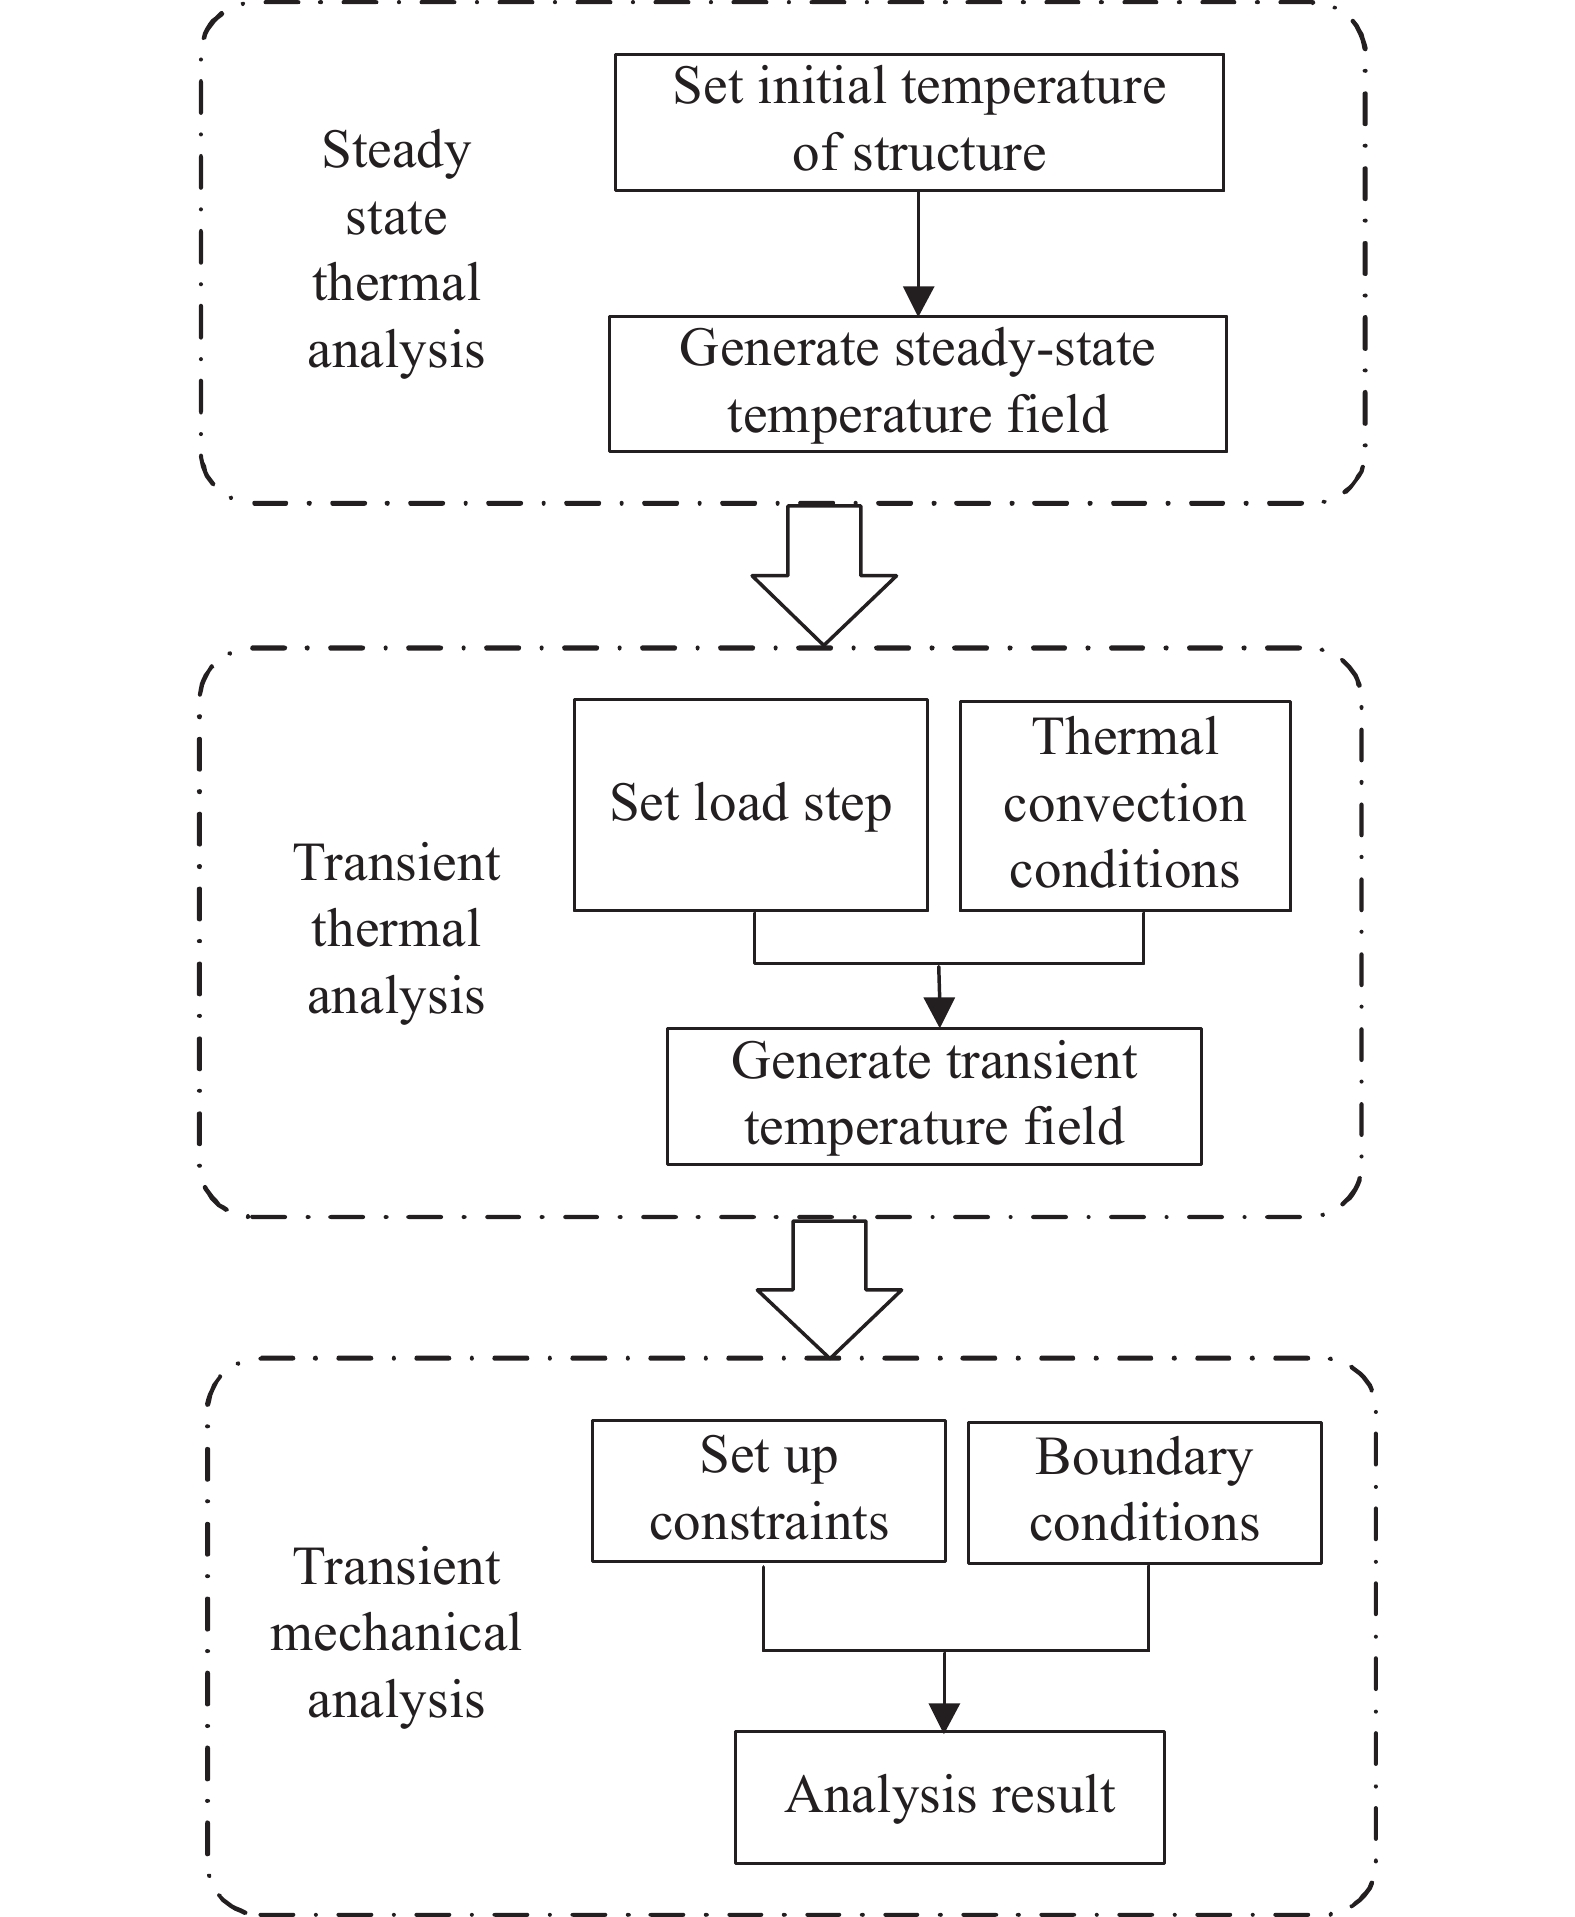
Fig. 2. Finite element calculation process of thermal strain field of satellite antenna structure
Fig. 3. Characteristics of strain field distribution under uniform temperature load at 120 ℃
Fig. 4. Strain field variation curves under uniform temperature load
Fig. 5. FBG sensor temperature and strain monitoring system for high and low temperature environments. (a) Monitoring test system composition; (b) Physical photo of the monitoring test system: 1.PC 2.Strain gauges 3.FBG demodulator 4. Temperature test chamber
Fig. 6. Aluminum structural specimens. (a) Layout of structural specimen sensor; (b) Diagram of structure physical: 1.Resistance strain gauge 2.FBG strain sensor 3.FBG temperature sensor
Fig. 7. FBG temperature sensor center wavelength versus temperature. (a) Warming process; (b) Cooling process
Fig. 8. Thermal strain measurement of FBG strain transducer as a function of structure temperature. (a) FBG1; (b) FBG2; (c) FBG3
Fig. 9. Distribution characteristics of the temperature and strain fields of the satellite antenna under the temperature load of 100 ℃. (a) Distribution characteristics of the temperature field; (b) Distribution characteristics of the strain field
Fig. 10. Distribution characteristics of temperature and strain fields of satellite antenna under long time high temperature environment. (a) Distribution characteristics of temperature field; (b) Distribution characteristics of strain field
Fig. 11. Diagram of the independent variable of the change curve
Fig. 12. Temperature variation curve under different temperature loads
Fig. 13. Strain variation curve under different temperature loads
Fig. 14. Schematic diagram of measurement points and error evaluation points
Fig. 15. Satellite antenna thermal strain field fiber optic monitoring test system. (a) Thermal strain field monitoring test system composition; (b) Photos of the thermal strain field monitoring test system: 1. structural specimen 2.Strain gauges 3. Thermal loading device 4. Multi-channel pyrometer 5. FBG Demodulator 6.PC
Fig. 16. Satellite antenna under 100 °C temperature load. (a) Reconstructed temperature field; (b) Reconstructed strain field
Fig. 17. Comparison of measured and reconstructed values under 100 ℃ temperature load. (a) Comparison of temperature fields; (b) Comparison of strain fields
Material parameter type | Material parameter value | Density/g·cm−3 | 2.81 | Elastic modulus/GPa | 71.7 | Poisson's ratio | 0.25 | Thermal conductivity/W·m−1·K−1 | 173 | Specific heat capacity/J·kg−1·K−1 | 960 | Thermal expansion coefficient/℃−1 | 23.6×10⁻⁶ |
|
Table 1. Material parameters of finite element model of satellite antenna structure
Temperature Sensor | Loading method | Temperature sensitivity/pm·℃−1 | Linearity | FBG4 | Heating | 10.21 | 0.993 | Cooling | 10.18 | 0.992 | FBG5 | Heating | 10.23 | 0.996 | Cooling | 10.25 | 0.991 | FBG6 | Heating | 10.19 | 0.995 | Cooling | 10.21 | 0.996 |
|
Table 2. FBG temperature sensor sensitivity and linearity
Strain sensors | Loading method | Maximum absolute error/με | Average relative error | FBG1 | Heating | 68.6 | 2.38% | Cooling | 52.9 | 2.26% | FBG2 | Heating | 49.5 | 2.65% | Cooling | 55.1 | 3.15% | FBG3 | Heating | 64.7 | 1.95% | Cooling | 73.3 | 2.28% |
|
Table 3. FBG strain sensor maximum absolute error and average relative error
Temperature/℃ | RMSE | Temperature field | Strain field | 30 | 0.67% | 1.06% | 40 | 0.81% | 1.35% | 50 | 0.99% | 1.45% | 60 | 1.15% | 1.56% | 70 | 1.31% | 1.69% | 80 | 1.49% | 1.86% | 90 | 1.55% | 1.92% | 100 | 1.76% | 2.23% | Average value | 1.22% | 1.64% |
|
Table 4. Reconstruction error of temperature field and strain field at different temperatures
Temperature/℃ | First cycle | | Second cycle | | Third cycle | Temperature field | | Strain field | | Temperature field | | Strain field | | Temperature field | | Strain field | Heating | Cooling | | Heating | Cooling | | Heating | Cooling | | Heating | Cooling | | Heating | Cooling | | Heating | Cooling | 30 | 1.05% | 1.09% | | 2.16% | 2.21% | | 1.08% | 1.16% | | 2.12% | 2.18% | | 1.06% | 1.12% | | 2.18% | 2.15% | 40 | 1.34% | 1.39% | 2.55% | 2.57% | 1.37% | 1.31% | 2.51% | 2.61% | 1.26% | 1.34% | 2.65% | 2.58% | 50 | 1.75% | 1.72% | 3.02% | 3.06% | 1.79% | 1.85% | 3.06% | 3.12% | 1.82% | 1.86% | 3.13% | 3.15% | 60 | 2.15% | 2.19% | 3.49% | 3.52% | 2.21% | 2.26% | 3.45% | 3.55% | 2.19% | 2.12% | 3.53% | 3.59% | 70 | 2.47% | 2.45% | 3.95% | 3.82% | 2.52% | 2.47% | 3.85% | 3.82% | 2.54% | 2.46% | 3.92% | 3.84% | 80 | 2.75% | 2.65% | 4.39% | 4.35% | 2.82% | 2.75% | 4.36% | 4.45% | 2.85% | 2.79% | 4.47% | 4.39% | 90 | 3.21% | 3.37% | 4.85% | 4.82% | 3.35% | 3.19% | 4.91% | 4.92% | 3.26% | 3.23% | 4.86% | 4.89% | 100 | 3.49% | 3.49% | 5.52% | 5.52% | 3.51% | 3.50% | 5.46% | 5.48% | 3.54% | 3.54% | 5.54% | 5.54% | Average | 2.28% | 2.29% | 3.74% | 3.73% | 2.33% | 2.31% | 3.72% | 3.77% | 2.32% | 2.31% | 3.79% | 3.77% |
|
Table 5. Reconstruction errors between reconstructed strain field and theoretically calculated strain field at different temperatures
Temperature/℃ | First cycle | | Second cycle | | Third cycle | Temperature field | | Strain field | | Temperature field | | Strain field | | Temperature field | | Strain field | Heating | Cooling | | Heating | Cooling | | Heating | Cooling | | Heating | Cooling | | Heating | Cooling | | Heating | Cooling | 30 | 1.58% | 1.49% | | 3.76% | 3.59% | | 1.49% | 1.32% | | 3.59% | 3.61% | | 1.32% | 1.42% | | 3.61% | 3.72% | 40 | 1.76% | 1.65% | 4.79% | 4.72% | 1.57% | 1.64% | 4.97% | 4.84% | 1.78% | 1.75% | 4.82% | 4.68% | 50 | 2.53% | 2.59% | 5.58% | 5.76% | 2.69% | 2.58% | 5.65% | 5.58% | 2.42% | 2.56% | 5.52% | 5.48% | 60 | 2.97% | 3.16% | 6.75% | 6.82% | 2.78% | 2.76% | 6.93% | 6.87% | 2.87% | 2.99% | 6.83% | 6.92% | 70 | 3.46% | 3.59% | 7.35% | 7.64% | 3.24% | 3.36% | 7.75% | 7.64% | 3.37% | 3.25% | 7.59% | 7.48% | 80 | 3.98% | 4.15% | 7.82% | 7.95% | 3.87% | 3.95% | 7.92% | 7.84% | 3.88% | 3.96% | 7.89% | 7.98% | 90 | 4.62% | 4.71% | 8.05% | 8.11% | 4.78% | 4.54% | 8.16% | 8.25% | 4.54% | 4.52% | 8.13% | 8.15% | 100 | 5.48% | 5.49% | 8.42% | 8.43% | 5.12% | 5.12% | 8.38% | 8.36% | 5.43% | 5.42% | 8.32% | 8.35% | Average | 3.30% | 3.35% | 6.57% | 6.63% | 3.19% | 3.16% | 6.67% | 6.62% | 3.20% | 3.23% | 6.59% | 6.60% |
|
Table 6. Reconstruction error between reconstructed strain field and real strain field at different temperatures
Weight quality/g | 40 ℃ temperature load | | 70 ℃ temperature load | | 100 ℃ temperature load | Temperature field | | Strain field | | Temperature field | | Strain field | | Temperature field | | Strain field | Weight gain | Weight loss | | Weight gain | Weight loss | | Weight gain | Weight loss | | Weight gain | Weight loss | | Weight gain | Weight loss | | Weight gain | Weight loss | 0 | 1.82% | 1.76% | | 4.65% | 4.68% | | 3.48% | 3.62% | | 7.28% | 7.16% | | 5.35% | 5.48% | | 8.34% | 8.35% | 200 | 1.75% | 1.88% | 4.98% | 4.91% | 3.56% | 3.51% | 7.65% | 7.66% | 5.45% | 5.54% | 8.87% | 8.68% | 400 | 1.79% | 1.94% | 5.34% | 5.24% | 3.51% | 3.48% | 8.05% | 8.12% | 5.47% | 5.48% | 9.35% | 9.18% | 600 | 1.86% | 1.84% | 5.79% | 5.85% | 3.42% | 3.55% | 8.72% | 8.85% | 5.52% | 5.64% | 9.94% | 9.82% | 800 | 1.95% | 1.82% | 6.12% | 6.24% | 3.35% | 3.52% | 9.25% | 9.22% | 5.46% | 5.62% | 10.26% | 10.14% | 1000 | 1.84% | 1.89% | 6.53% | 6.59% | 3.48% | 3.42% | 9.56% | 9.61% | 5.54% | 5.58% | 10.85% | 10.76% | Average | 1.84% | 1.86% | 5.57% | 5.59% | 3.47% | 3.52% | 8.42% | 8.44% | 5.47% | 5.56% | 9.60% | 9.49% |
|
Table 7. Reconstruction errors of structural temperature and strain fields under thermodynamic coupling