• Laser & Optoelectronics Progress
  • Vol. 57, Issue 5, 051401 (2020)
Wen Wang, Zhijiang Xie*, Zengya Zhao, and Shengyong Zhang
Author Affiliations
  • College of Mechanical Engineering, Chongqing University, Chongqing 400044, China
  • show less
    DOI: 10.3788/LOP57.051401 Cite this Article Set citation alerts
    Wen Wang, Zhijiang Xie, Zengya Zhao, Shengyong Zhang. Influence of Scanning Path on the Temperature Field in Selective Laser Melting[J]. Laser & Optoelectronics Progress, 2020, 57(5): 051401 Copy Citation Text show less
    Gaussian heat source model
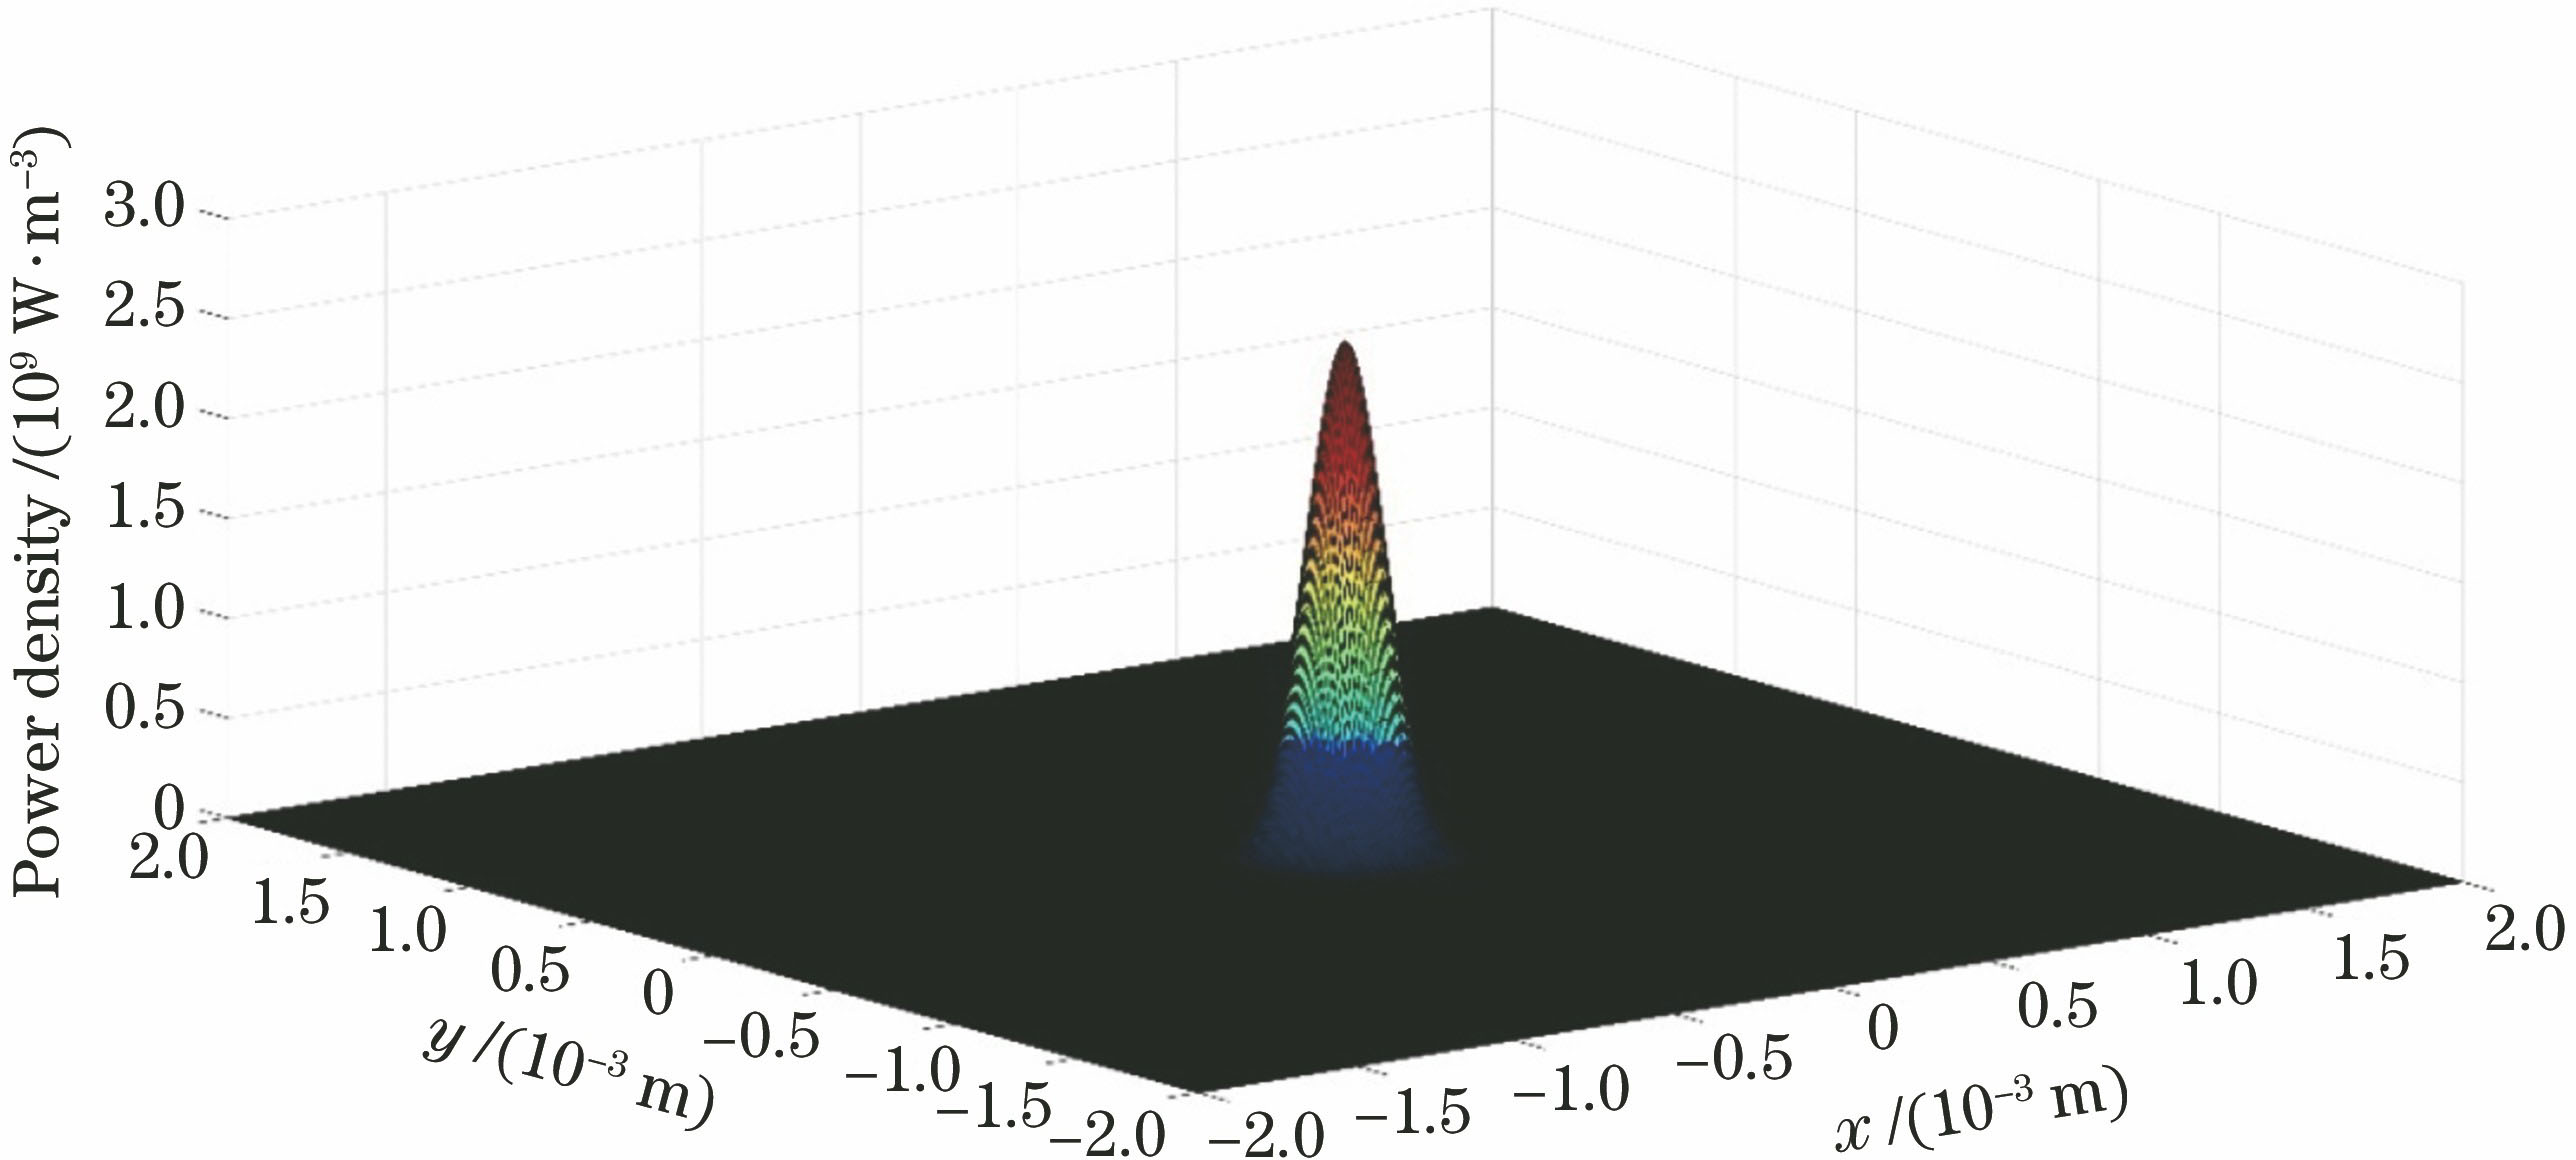
    Fig. 1. Gaussian heat source model
    Parameters of thermophysical properties for Ti6Al4V at different temperatures. (a) Conductivity; (b) specific heat; (c) density; (d) emissivity
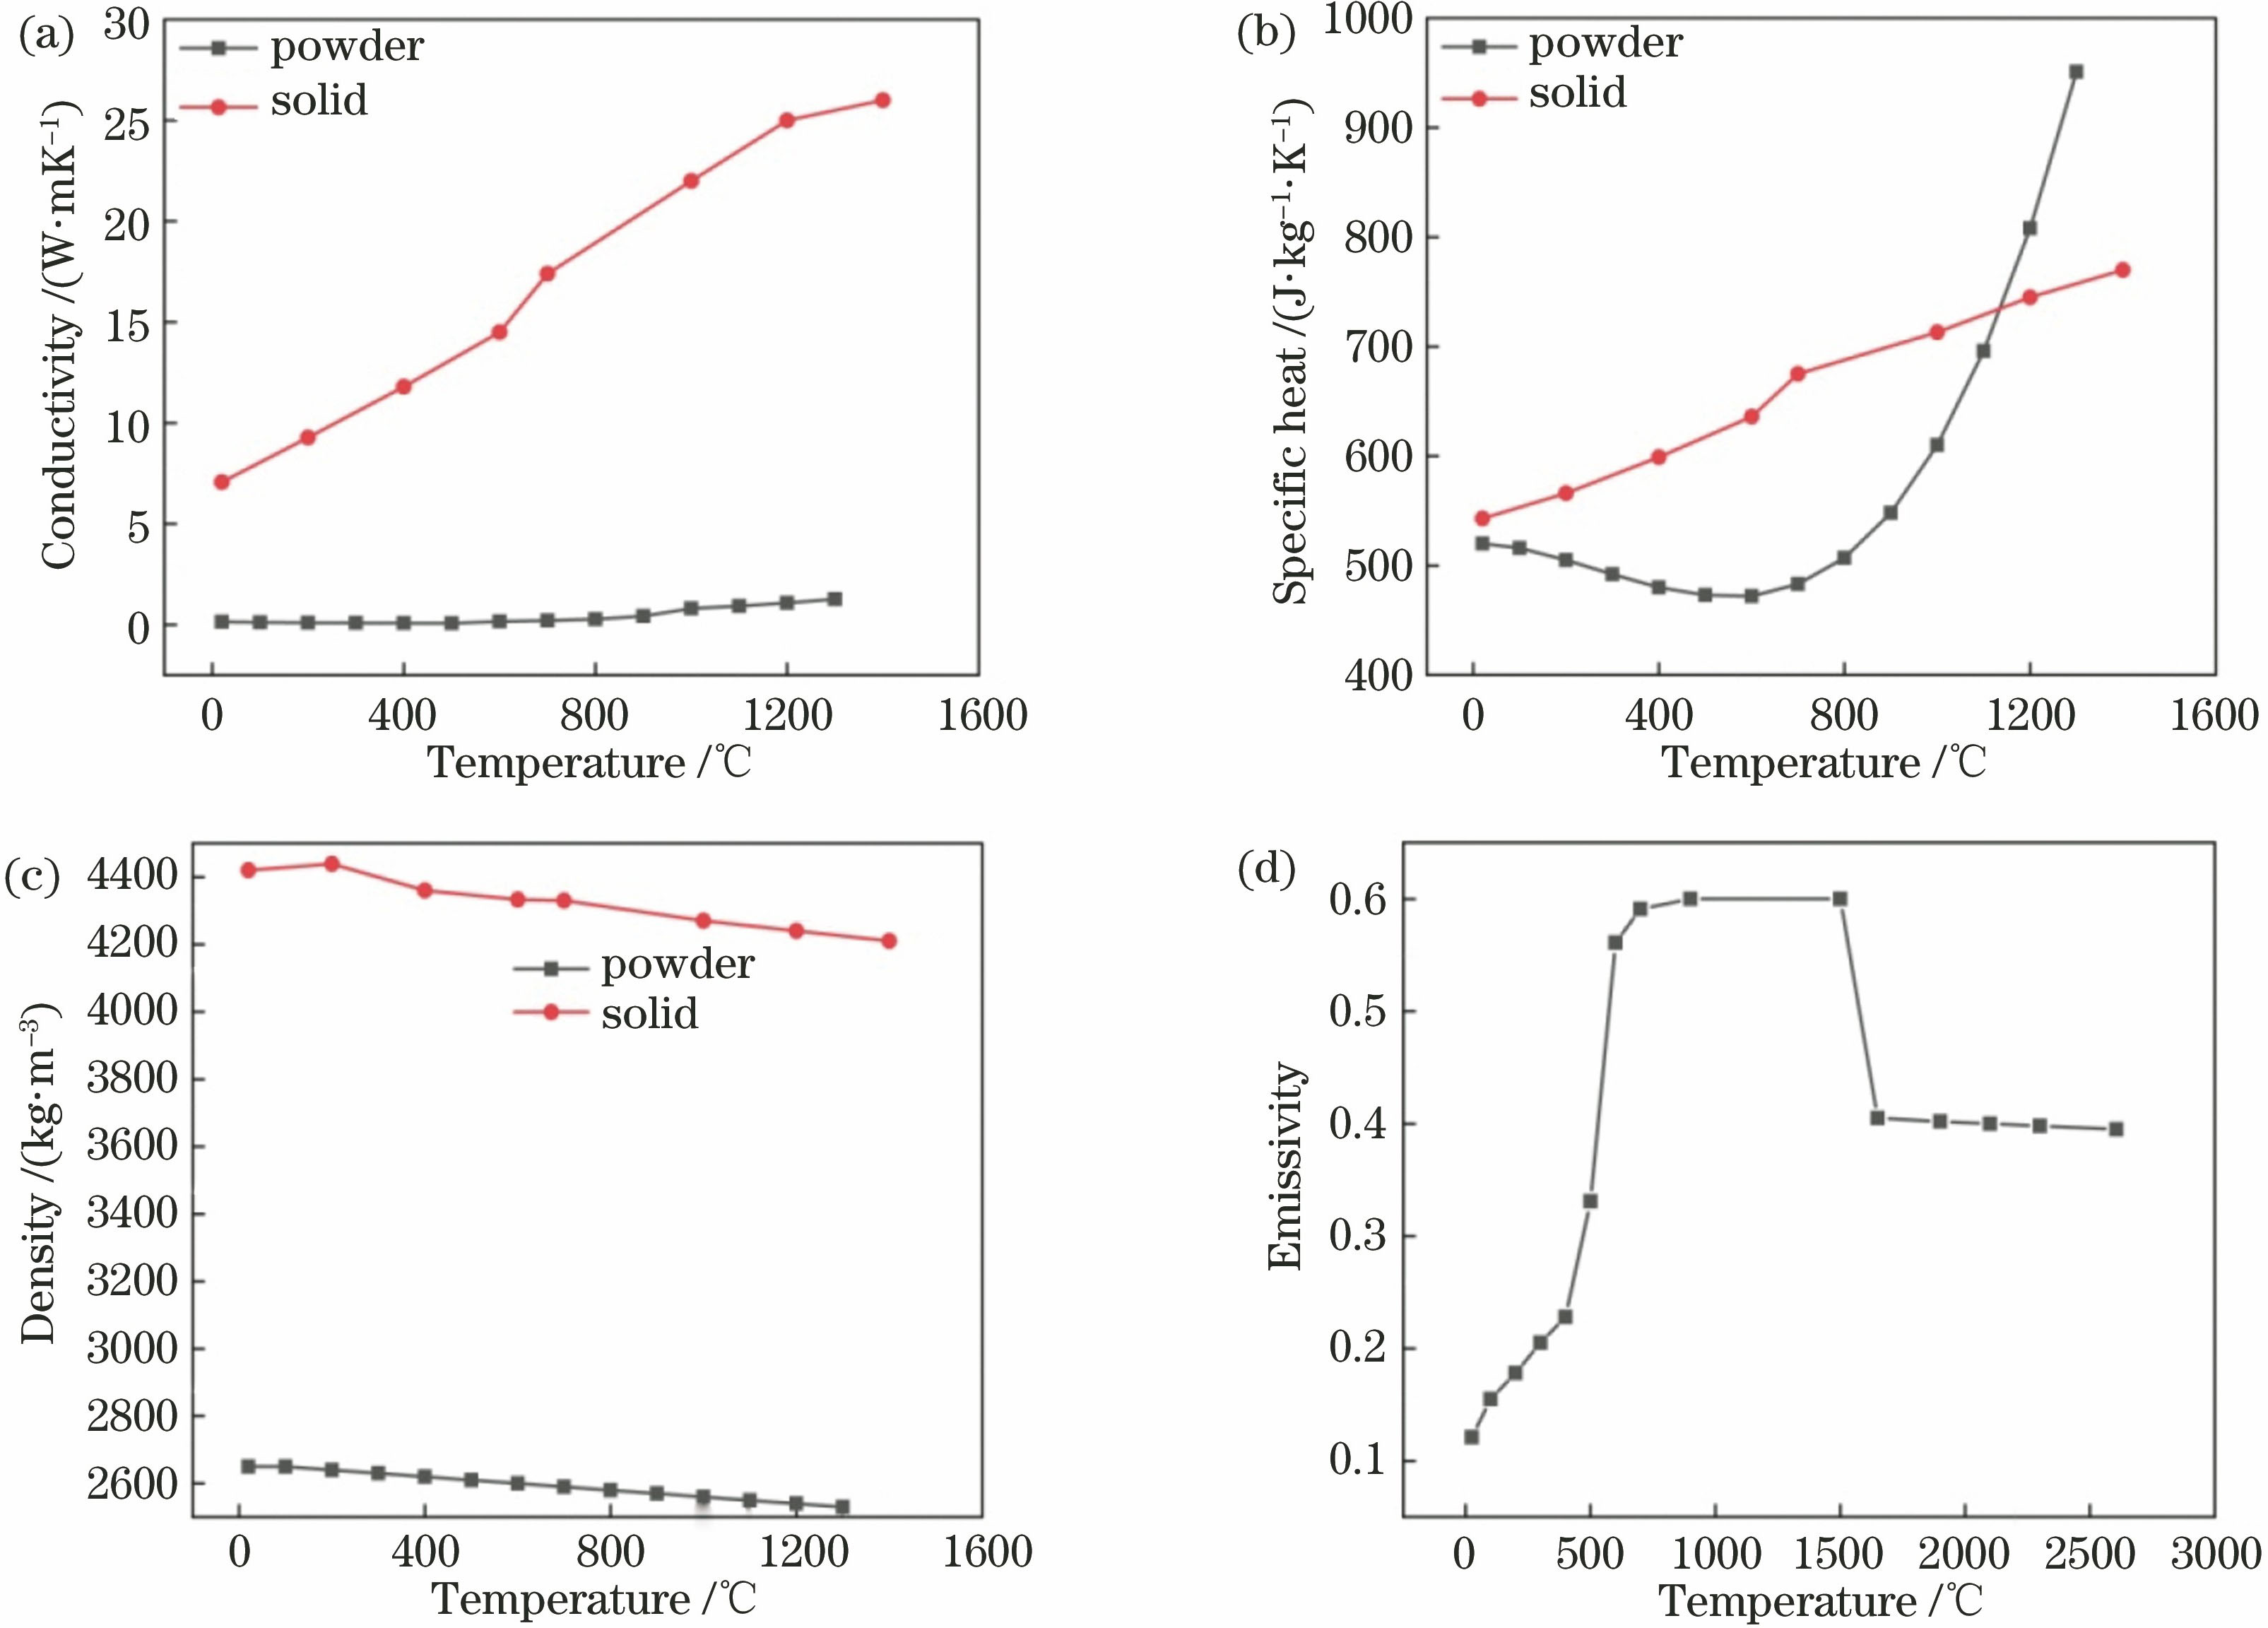
    Fig. 2. Parameters of thermophysical properties for Ti6Al4V at different temperatures. (a) Conductivity; (b) specific heat; (c) density; (d) emissivity
    Finite element model
    Fig. 3. Finite element model
    Laser scanning path. (a) Long-side scanning; (b) short-side scanning
    Fig. 4. Laser scanning path. (a) Long-side scanning; (b) short-side scanning
    Distribution of the temperature field. (a) Long-side scanning; (b) short-side scanning
    Fig. 5. Distribution of the temperature field. (a) Long-side scanning; (b) short-side scanning
    Comparison of temperature results. (a) Temperature standard deviation; (b) temperature gradient
    Fig. 6. Comparison of temperature results. (a) Temperature standard deviation; (b) temperature gradient
    Change of temperature gradient with time at points A, B, and C. (a) Long-side scanning; (b) short-side scanning
    Fig. 7. Change of temperature gradient with time at points A, B, and C. (a) Long-side scanning; (b) short-side scanning
    Comparison of scanning results of temperature. (a) Temperature standard deviation of long-side scanning; (b) temperature gradient of long-side scanning; (c) temperature standard deviation of short-side scanning; (d) temperature gradient of short-side scanning
    Fig. 8. Comparison of scanning results of temperature. (a) Temperature standard deviation of long-side scanning; (b) temperature gradient of long-side scanning; (c) temperature standard deviation of short-side scanning; (d) temperature gradient of short-side scanning
    Experimental samples. (a) Experimental sample of long-side scanning; (b) experimental sample of short-side scanning
    Fig. 9. Experimental samples. (a) Experimental sample of long-side scanning; (b) experimental sample of short-side scanning
    Distribution of residual stress
    Fig. 10. Distribution of residual stress
    Residual stress value under preheating conditions. (a) Long-side scanning; (b) short-side scanning
    Fig. 11. Residual stress value under preheating conditions. (a) Long-side scanning; (b) short-side scanning
    Metallographic diagrams of the formed part. (a) Long-side scanning at 20 ℃; (b) long-side scanning at 300 ℃; (c) short-side scanning at 20 ℃; (d) short-side scanning at 300 ℃
    Fig. 12. Metallographic diagrams of the formed part. (a) Long-side scanning at 20 ℃; (b) long-side scanning at 300 ℃; (c) short-side scanning at 20 ℃; (d) short-side scanning at 300 ℃
    ParameterValue
    Laser power P /WLaser velocity V /(m·s-1)Spot size D /μmHatch spacing δ /μmPowder layer thickness θ /μm160100020020040
    Powder initial temperature T0/℃25
    Table 1. Finite element analysis parameters
    Wen Wang, Zhijiang Xie, Zengya Zhao, Shengyong Zhang. Influence of Scanning Path on the Temperature Field in Selective Laser Melting[J]. Laser & Optoelectronics Progress, 2020, 57(5): 051401
    Download Citation