
Yonghong Wang, Mingyi Zhang, Chunwei Zhang, Xiaoyu Bai, Qian Liu. Application of FBG Strain Sensor with Low Temperature Sensitivity in Static Pressure PHC Pipe Pile Penetration Test[J]. Laser & Optoelectronics Progress, 2018, 55(4): 040602
- Laser & Optoelectronics Progress
- Vol. 55, Issue 4, 040602 (2018)
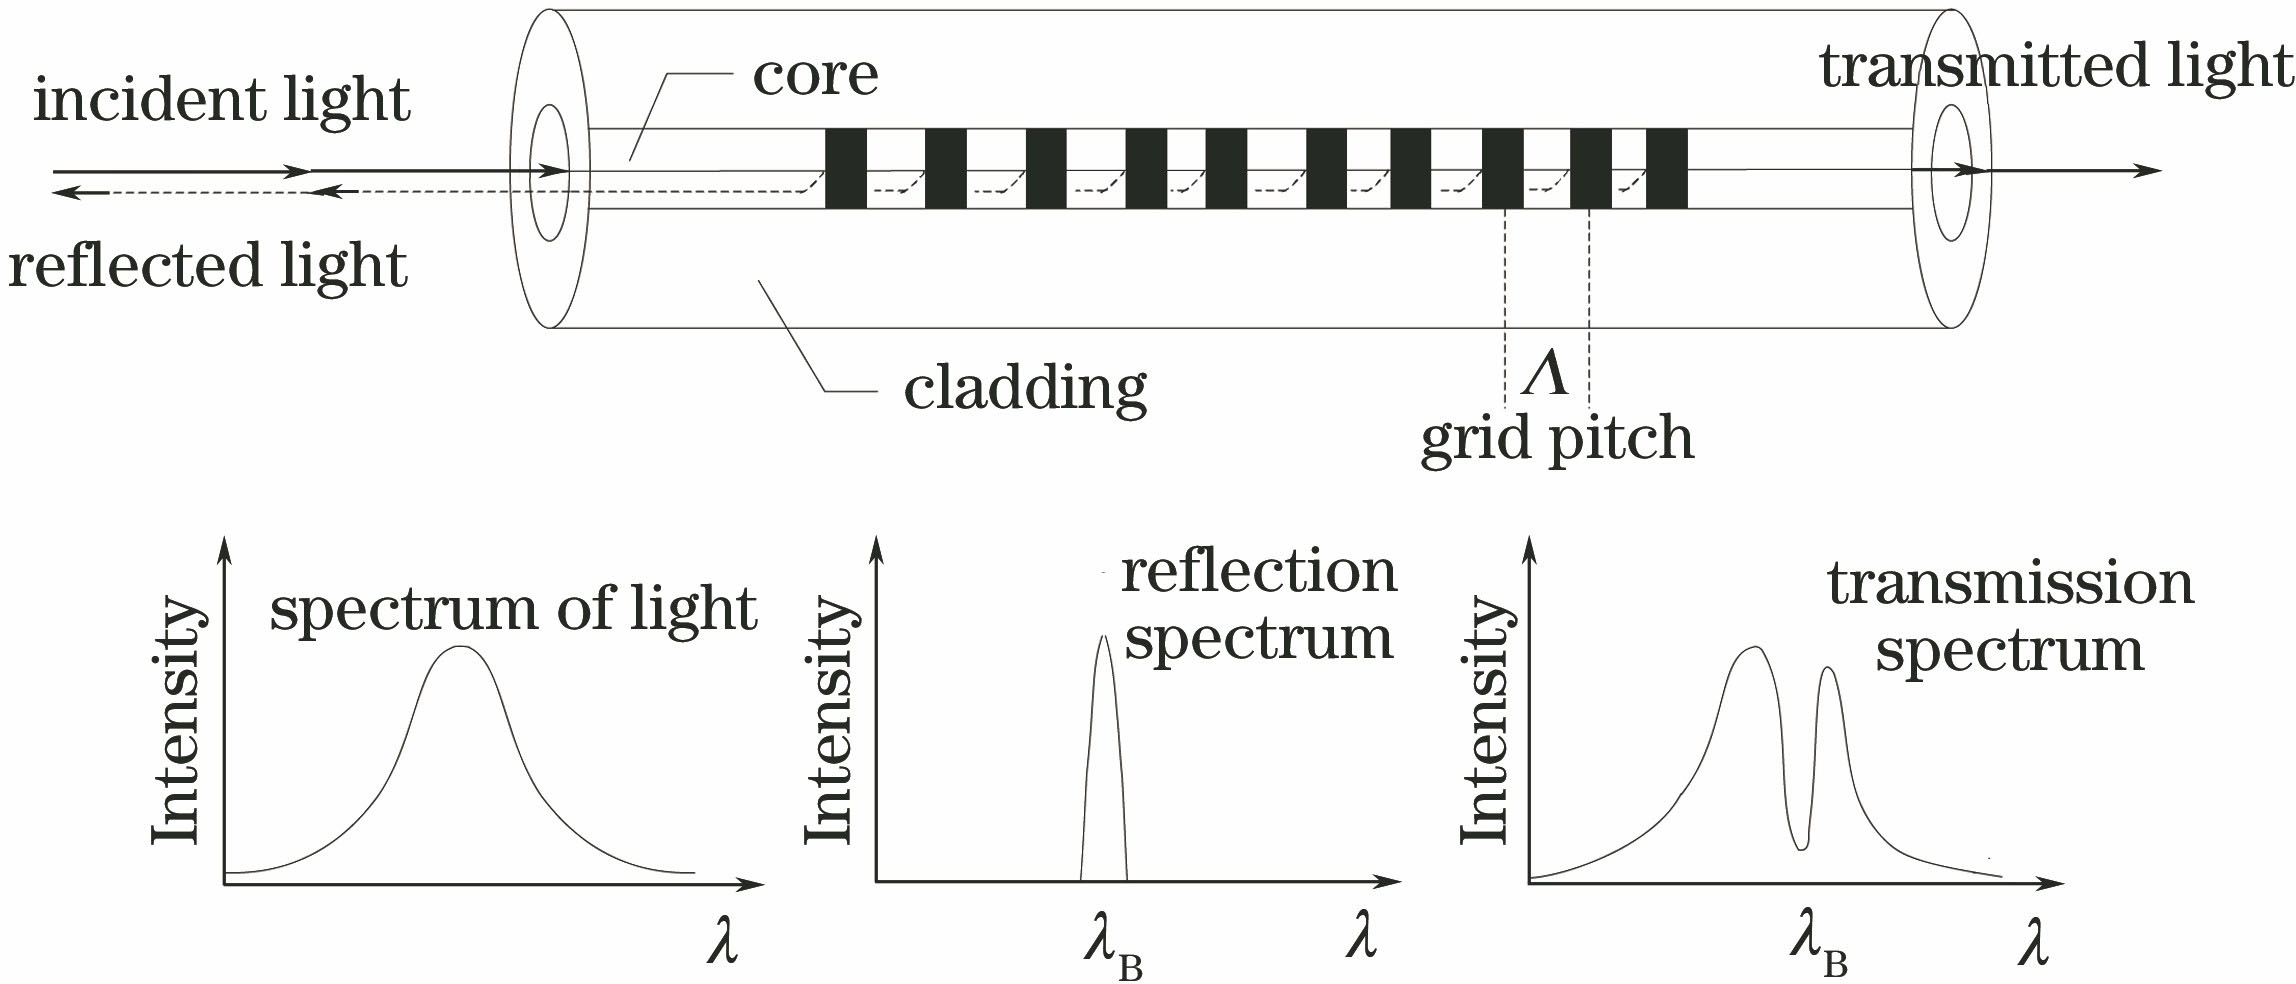
Fig. 1. Sensing principle of FBG
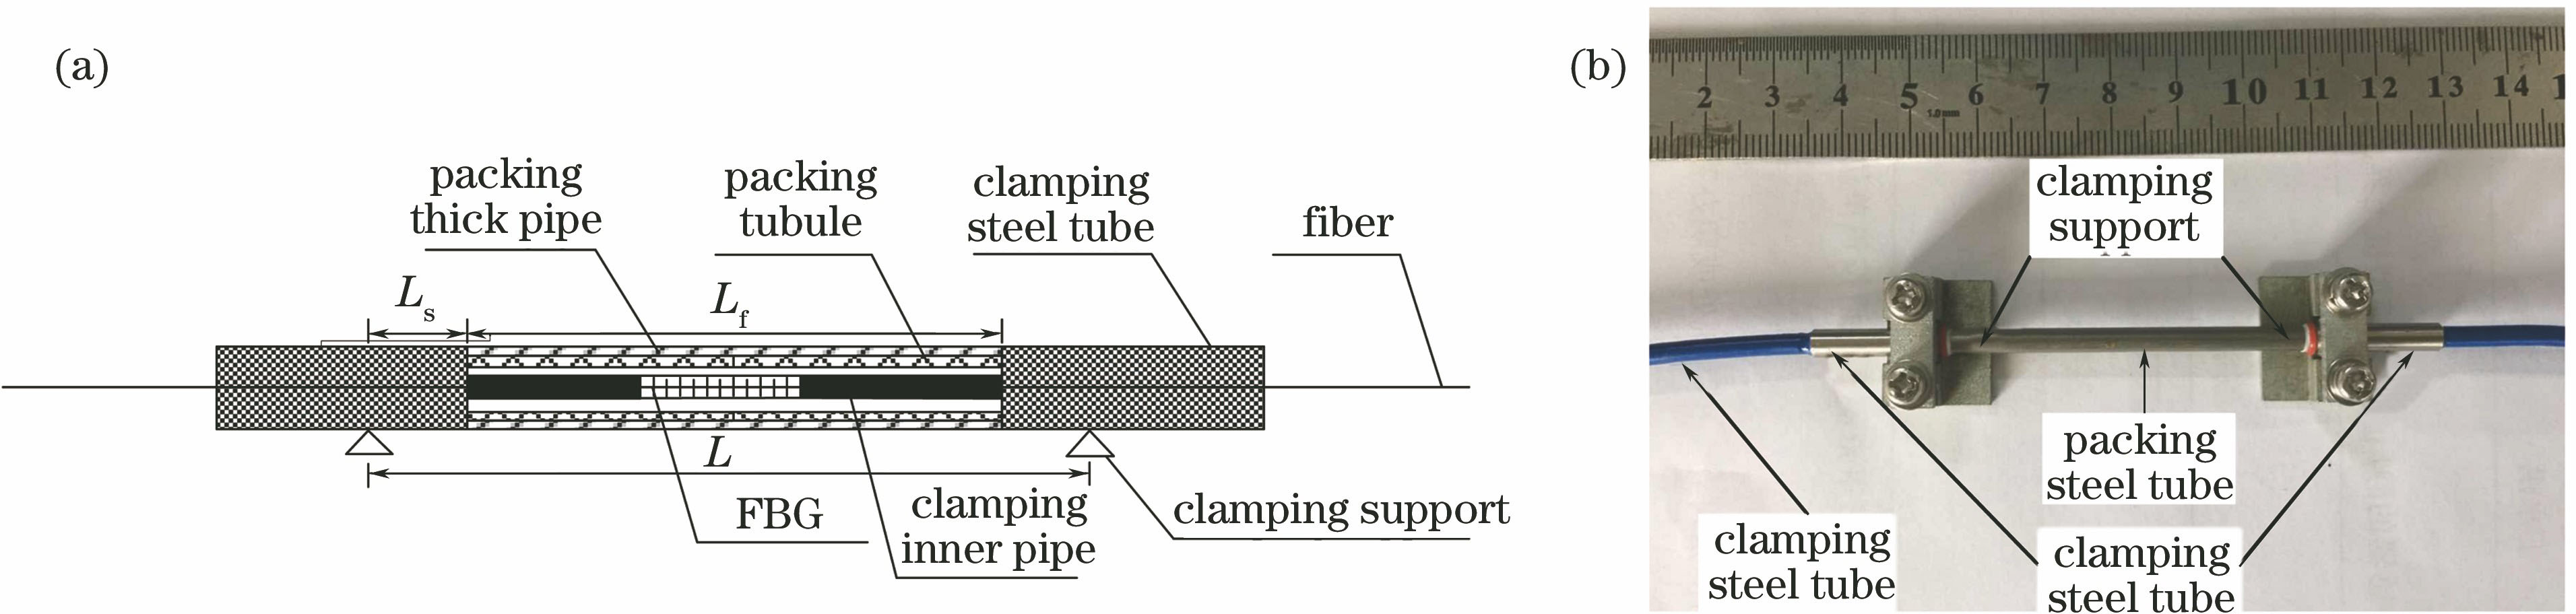
Fig. 2. (a) Structure and (b) installation of FBG strain sensors with low temperature sensitivity
Fig. 3. Relationship between central wavelength variation and temperature under three temperature tests
Fig. 4. Relationship between the sensor central wavelength and bare FBG. (a)、(b)、(c) are sensors 1,2, 3, respectively
Fig. 5. FBG sensors distribution diagram
Fig. 6. Variations of pile shaft force.(a), (b), (c), (d) are pile shafts SZ1, SZ2, SZ3, SZ4, respectively
Fig. 7. Variations of toe resistance and sides resistance during installation. (a), (b), (c), (d) are pile shafts SZ1, SZ2, SZ3, SZ4, respectively
|
Table 1. Soil distribution and physical-mechanical properties of subsoil at testing site
|
Table 2. Center wavelength of SZ1 grating and wavelength change when the grating is injected to 18 m

Set citation alerts for the article
Please enter your email address
© Copyright 2018-2021 | Chinese Laser Press. All Rights Reserved 沪ICP备15018463号-20