• Acta Optica Sinica
  • Vol. 44, Issue 7, 0712001 (2024)
Ying Wang1, Yubo Ni1, Zhaozong Meng1, Nan Gao1, Tong Guo2, Zeqing Yang1, Guofeng Zhang3, Wei Yin4, Hongwei Zhao3、4, and Zonghua Zhang1、*
Author Affiliations
  • 1School of Mechanical Engineering, Hebei University of Technology, Tianjin 300401, China
  • 2School of Precision Instrument and Optoelectronics Engineering, Tianjin University, Tianjin 300072, China
  • 3School of Mechanical Engineering, Xi an Jiaotong University, Xi an 710049, Shaanxi , China
  • 4National Key Laboratory of Strength and Structural Integrity, Aircraft Strength Research Institute of China, Xi an 710065, Shaanxi , China
  • show less
    DOI: 10.3788/AOS231894 Cite this Article Set citation alerts
    Ying Wang, Yubo Ni, Zhaozong Meng, Nan Gao, Tong Guo, Zeqing Yang, Guofeng Zhang, Wei Yin, Hongwei Zhao, Zonghua Zhang. Adaptive Coding Fringe Projection Profilometry on Color Reflective Surfaces[J]. Acta Optica Sinica, 2024, 44(7): 0712001 Copy Citation Text show less
    Establish projector-camera matching relationship. (a) Coordinate system transformation relationship; (b) identification point bitmap
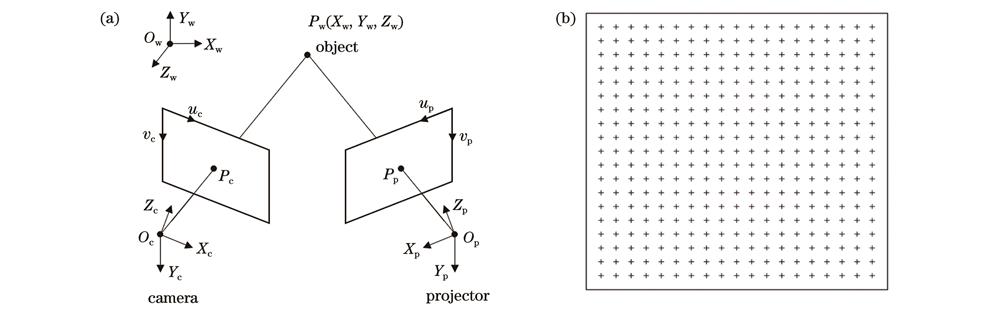
    Fig. 1. Establish projector-camera matching relationship. (a) Coordinate system transformation relationship; (b) identification point bitmap
    Simulated sinusoidal fringe image and its cross-section. (a) Standard sinusoidal fringe pattern; (b) saturated sinusoidal fringe pattern
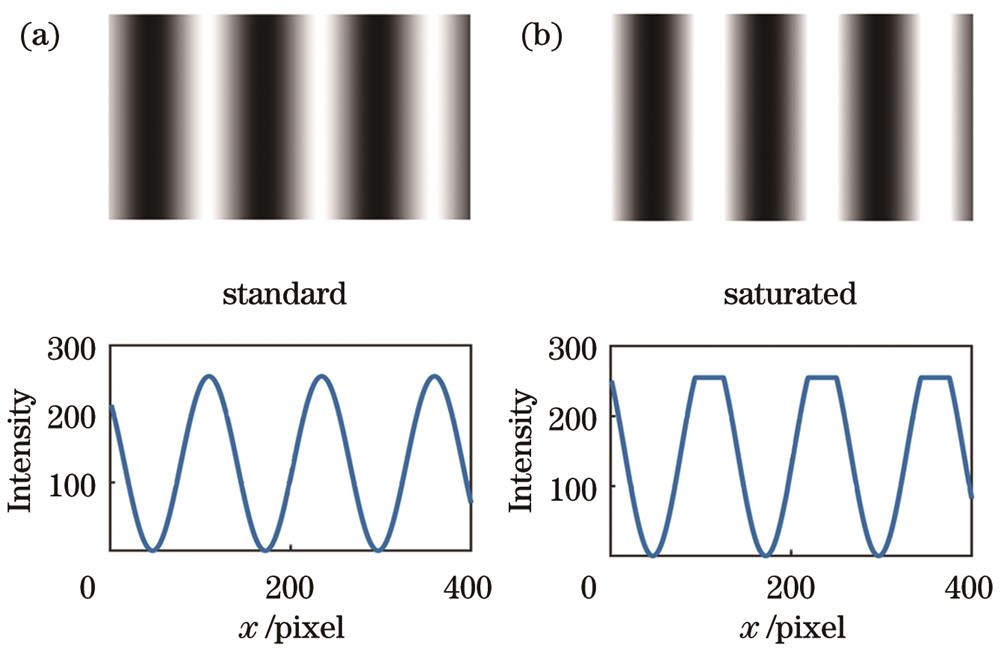
    Fig. 2. Simulated sinusoidal fringe image and its cross-section. (a) Standard sinusoidal fringe pattern; (b) saturated sinusoidal fringe pattern
    Intensity profile of highly reflective region and unwrapped phase of the region. (a), (d) Highly reflective surface; (b), (e) projected complementary hue; (c), (f) changed saturation of projected color
    Fig. 3. Intensity profile of highly reflective region and unwrapped phase of the region. (a), (d) Highly reflective surface; (b), (e) projected complementary hue; (c), (f) changed saturation of projected color
    Flow chart of experimental method
    Fig. 4. Flow chart of experimental method
    Measure yellow ceramic cup surface. (a) Photo of yellow ceramic cup; (b) measured 3D shape
    Fig. 5. Measure yellow ceramic cup surface. (a) Photo of yellow ceramic cup; (b) measured 3D shape
    Analysis of measurement efficiency. (a) Selected area; (b) phase recovery of traditional fringe and coded fringe in selected region at different exposure time; (c) four regions; (d) integrity of unwrapped phase using traditional fringe at different exposure time in each region; (e) integrity of unwrapped phase using coded fringe at different exposure time in each region
    Fig. 6. Analysis of measurement efficiency. (a) Selected area; (b) phase recovery of traditional fringe and coded fringe in selected region at different exposure time; (c) four regions; (d) integrity of unwrapped phase using traditional fringe at different exposure time in each region; (e) integrity of unwrapped phase using coded fringe at different exposure time in each region
    Comparison of measured curve and fitted curve of cup surface. (a) Multiple exposures; (b) proposed method
    Fig. 7. Comparison of measured curve and fitted curve of cup surface. (a) Multiple exposures; (b) proposed method
    LocationMean error /mmStandard deviation /mm
    Multiple exposuresProposed methodMultiple exposuresProposed method
    200.44750.18650.16910.0774
    400.44710.18590.17060.0783
    600.44830.18200.16870.0776
    800.44690.18560.16950.0744
    1000.44710.18480.16930.0768
    Table 1. Analysis of accuracy verification results
    Ying Wang, Yubo Ni, Zhaozong Meng, Nan Gao, Tong Guo, Zeqing Yang, Guofeng Zhang, Wei Yin, Hongwei Zhao, Zonghua Zhang. Adaptive Coding Fringe Projection Profilometry on Color Reflective Surfaces[J]. Acta Optica Sinica, 2024, 44(7): 0712001
    Download Citation