• Laser & Optoelectronics Progress
  • Vol. 59, Issue 2, 0228001 (2022)
Qiufang Wei1、2、3, Yun Shao1、2、3、*, Kun Li1、2、3, Zhiqu Liu3, Fengli Zhang1、2、3, and Xianyu Guo3
Author Affiliations
  • 1Aerospace Information Research Institute, Chinese Academy of Sciences, Beijing 100094, China
  • 2University of Chinese Academy of Sciences, Beijing 100049, China
  • 3Zhejiang Key Laboratory of Microwave Target Characteristic Measurement and Remote Sensing, Deqing Academy of Satellite Applications, Huzhou , Zhejiang 313200, China
  • show less
    DOI: 10.3788/LOP202259.0228001 Cite this Article Set citation alerts
    Qiufang Wei, Yun Shao, Kun Li, Zhiqu Liu, Fengli Zhang, Xianyu Guo. Microwave Anechoic Chamber Measurement and Scatter Characteristics Analysis of Typical Wetland Vegetation in South China[J]. Laser & Optoelectronics Progress, 2022, 59(2): 0228001 Copy Citation Text show less
    Interior view of microwave characteristic measurement and simulation imaging science experiment platform
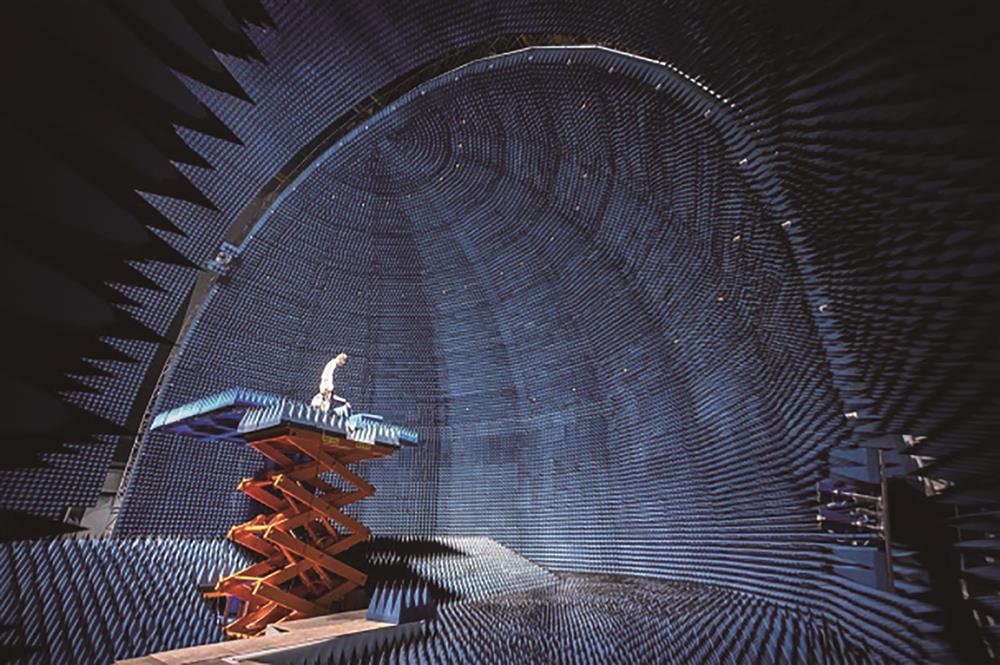
    Fig. 1. Interior view of microwave characteristic measurement and simulation imaging science experiment platform
    Diagram of measurement flow
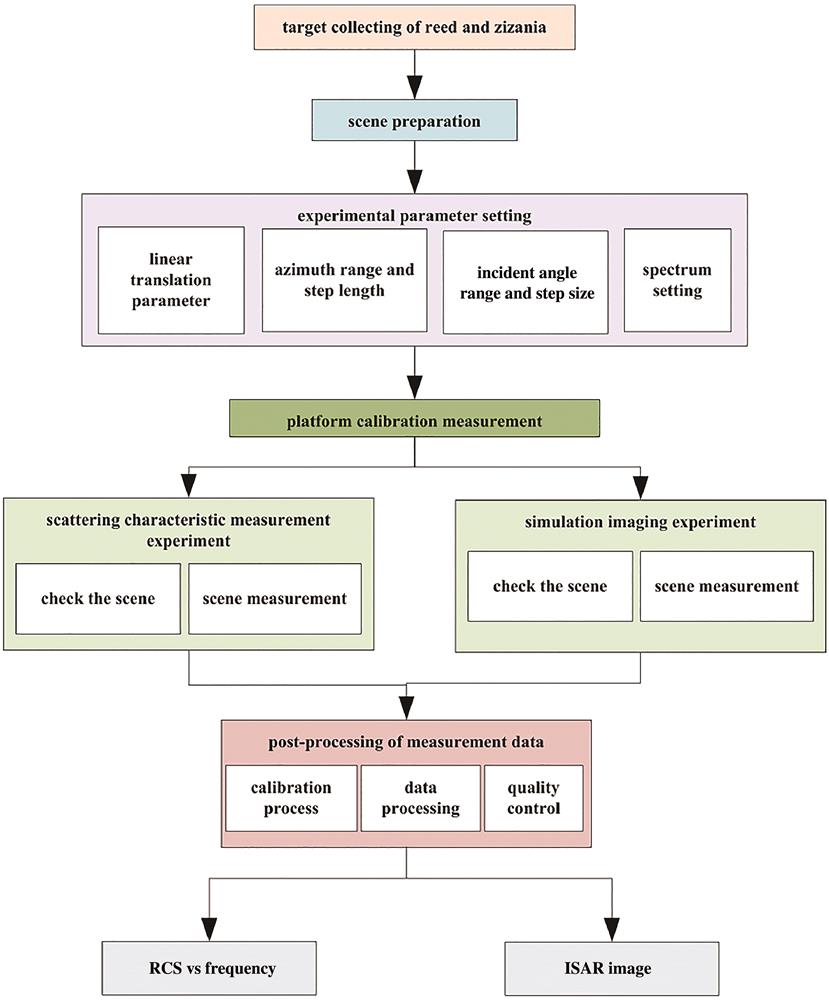
    Fig. 2. Diagram of measurement flow
    Measuring schematic diagrams of reed and zizania. (a) Reed scene; (b) zizania scene; (c) structure diagram of reed scene; (d) structure diagram of zizania scene
    Fig. 3. Measuring schematic diagrams of reed and zizania. (a) Reed scene; (b) zizania scene; (c) structure diagram of reed scene; (d) structure diagram of zizania scene
    Imaging of reed at 45° incidence angle and -135° azimuth. (a) C band; (b) X band; (c) Ku band
    Fig. 4. Imaging of reed at 45° incidence angle and -135° azimuth. (a) C band; (b) X band; (c) Ku band
    Imaging of zizania at 45° incidence angle and 0° azimuth. (a) C band; (b) X band; (c) Ku band
    Fig. 5. Imaging of zizania at 45° incidence angle and 0° azimuth. (a) C band; (b) X band; (c) Ku band
    Comparison of RCS of the medal ball between the measurement result by LAMP and the prediction by Mie series[16]
    Fig. 6. Comparison of RCS of the medal ball between the measurement result by LAMP and the prediction by Mie series[16]
    Measurement results of reed RCS at different incident angles and 0° azimuth angle in different bands. (a) C band (5.3 GHz); (b) X band (9.6 GHz); (c) Ku band (15 GHz)
    Fig. 7. Measurement results of reed RCS at different incident angles and 0° azimuth angle in different bands. (a) C band (5.3 GHz); (b) X band (9.6 GHz); (c) Ku band (15 GHz)
    RCS scattering curves of reed at 25°‒55° incident angle and 0° azimuth angle. (a) 25° incident angle; (b) 35° incident angle; (c) 45° incident angle; (d) 55° incident angle
    Fig. 8. RCS scattering curves of reed at 25°‒55° incident angle and 0° azimuth angle. (a) 25° incident angle; (b) 35° incident angle; (c) 45° incident angle; (d) 55° incident angle
    Measurement results of zizania RCS at different incident angles and 0° azimuth angle in different bands.(a) C band (5.3 GHz); (b) X band (9.6 GHz); (c) Ku band (15 GHz)
    Fig. 9. Measurement results of zizania RCS at different incident angles and 0° azimuth angle in different bands.(a) C band (5.3 GHz); (b) X band (9.6 GHz); (c) Ku band (15 GHz)
    RCS scattering curves of zizania at 25°‒55° incident angle and 0° azimuth angle. (a) 25° incident angle; (b) 35° incident angle; (c) 45° incident angle; (d) 55° incident angle
    Fig. 10. RCS scattering curves of zizania at 25°‒55° incident angle and 0° azimuth angle. (a) 25° incident angle; (b) 35° incident angle; (c) 45° incident angle; (d) 55° incident angle
    RCS images of reed and zizania at 20° incident angle and 0° azimuth angle from 9 to 17 GHz. (a) Logarithmic RCS_VH; (b) scatter plots of ratio of logarithmic RCS_HH to logarithmic RCS_VV with logarithmic RCS_VH
    Fig. 11. RCS images of reed and zizania at 20° incident angle and 0° azimuth angle from 9 to 17 GHz. (a) Logarithmic RCS_VH; (b) scatter plots of ratio of logarithmic RCS_HH to logarithmic RCS_VV with logarithmic RCS_VH
    Two dimensional RCS scatter plots of reed and zizania at 25° incident angle and 0° azimuth angle from 7.8 to 17 GHz. (a) RCS scatter plots under VV and VH; (b) scatter plots of ratio of logarithmic RCS_VV to logarithmic RCS_VH with logarithmic RCS_VH
    Fig. 12. Two dimensional RCS scatter plots of reed and zizania at 25° incident angle and 0° azimuth angle from 7.8 to 17 GHz. (a) RCS scatter plots under VV and VH; (b) scatter plots of ratio of logarithmic RCS_VV to logarithmic RCS_VH with logarithmic RCS_VH
    Two dimensional RCS scatter plots of reed and zizania with incident angle of 55° and azimuth angle of 0° in frequency of 7~17 GHz. (a) RCS scatter plots under HH and VV; (b) scatter plots of ratio of logarithmic RCS_HH to logarithmic RCS_HV with logarithmic RCS_HH
    Fig. 13. Two dimensional RCS scatter plots of reed and zizania with incident angle of 55° and azimuth angle of 0° in frequency of 7~17 GHz. (a) RCS scatter plots under HH and VV; (b) scatter plots of ratio of logarithmic RCS_HH to logarithmic RCS_HV with logarithmic RCS_HH
    ParameterMeasuring range and accuracy
    Range of incidence angle /(°)0~90
    Accuracy of incident angle /(°)0.01
    Rotation range of turntable /(°)0~360
    Accuracy of turntable rotation /(°)0.01
    Linear displacement range of turntable /m4
    Accuracy of linear displacement of turntable /mm0.01
    Frequency range /GHz0.8~20
    Signal-to-noise ratio /dB-60
    Imaging modeSpotLight/StripMap/ISAR/Dual antenna InSAR imaging mode
    Table 1. Measurement index and accuracy of experiment platform
    ParameterReedZizania
    Average plant height /cm274.5183.5
    Moisture /%6090
    Density /m-2About 100About 4
    Table 2. Parameters of reed and zizania
    Frequency /GHzLogarithmic RCS_HH /dBsmLogarithmic RCS_VV /dBsmLogarithmic RCS_HV /dBsm
    ReedZiazniaDifferenceReedZiazniaDifferenceReedZiazniaDifference
    2.03.801.242.561.182.94-1.76-11.39-12.831.44
    2.5-0.821.00-1.82-0.231.20-1.43-13.31-15.802.49
    3.0-4.54-2.58-1.96-2.36-1.86-0.50-16.49-15.62-0.87
    3.5-3.69-2.32-1.37-2.03-1.10-0.93-15.15-14.38-0.76
    4.0-3.02-1.17-1.85-1.91-0.52-1.39-15.40-14.38-1.03
    4.5-1.56-1.32-0.25-1.29-0.53-0.76-17.13-14.82-2.31
    5.0-0.26-0.13-0.13-0.66-0.22-0.45-13.86-15.211.35
    5.5-0.390.80-1.18-0.01-0.100.09-13.73-15.431.69
    6.0-0.470.52-0.99-0.350.29-0.65-15.22-16.291.07
    6.5-0.36-0.20-0.16-0.830.43-1.26-12.41-15.413.01
    7.00.490.81-0.32-0.56-1.851.29-11.61-12.150.54
    Table 3. RCS comparison table of reed and zizania at 35° incident angle and 0° azimuth angle in low frequency points
    Qiufang Wei, Yun Shao, Kun Li, Zhiqu Liu, Fengli Zhang, Xianyu Guo. Microwave Anechoic Chamber Measurement and Scatter Characteristics Analysis of Typical Wetland Vegetation in South China[J]. Laser & Optoelectronics Progress, 2022, 59(2): 0228001
    Download Citation