
C.Gordon, R.Guzman, X.Leijtens, G.Carpintero. On-chip mode-locked laser diode structure using multimode interference reflectors[J]. Photonics Research, 2015, 3(1): 15
- Photonics Research
- Vol. 3, Issue 1, 15 (2015)
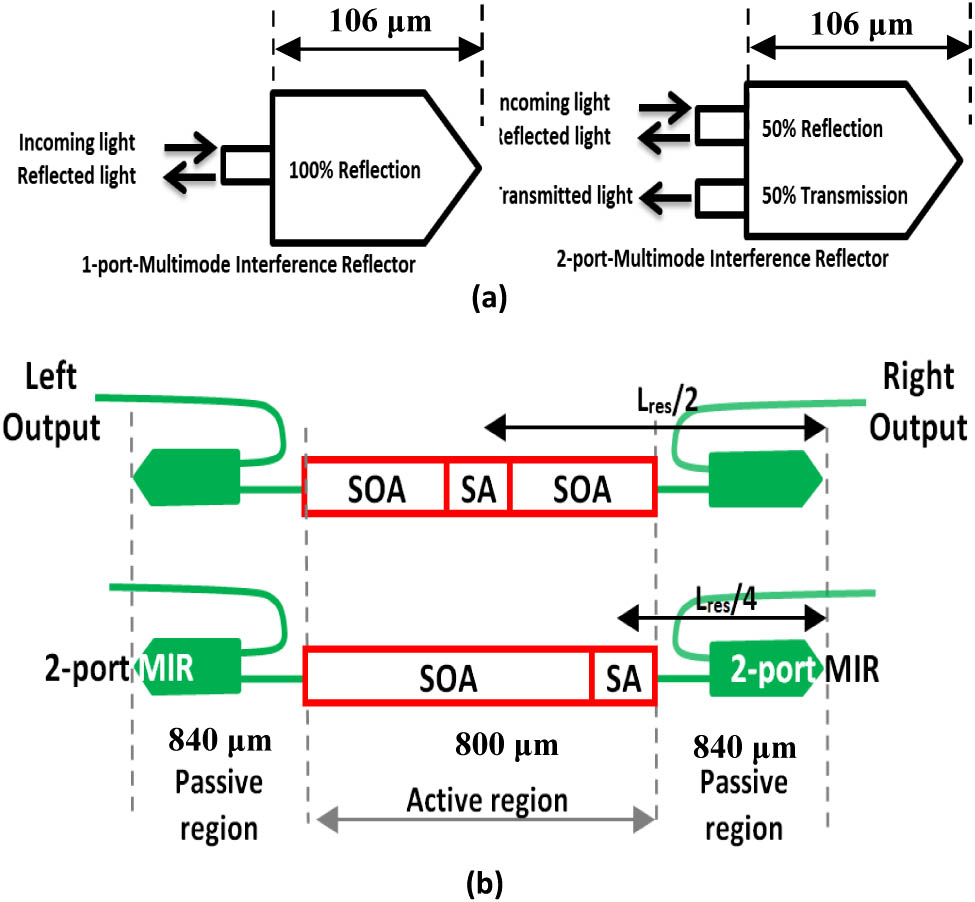
Fig. 1. (a) Two types of MIRs; (b) two types of OCMLLD structures.
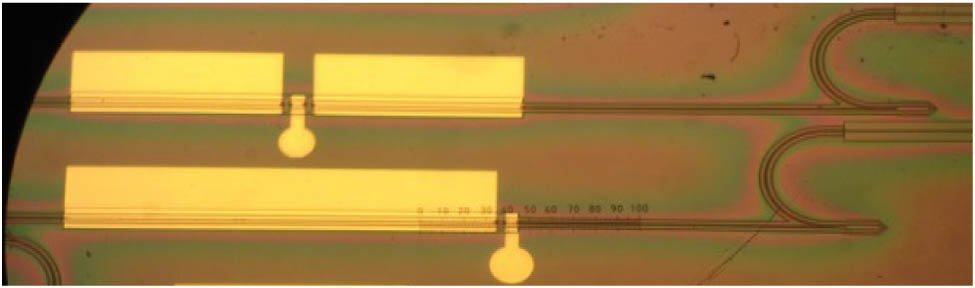
Fig. 2. Photograph of two on-chip mode-locked lasers, using MIRs, with the SA at the two different locations.
Fig. 3. Experimental setup: AC, autocorrelator; EDFA, erbium doped fiber amplifier; ESA, electrical spectrum analyzer; I, current source; Iso, optical isolator; OSA, optical spectrum analyzer; PC, polarization controller; PD, photodiode; PM, power meter; −V, reverse bias voltage.
Fig. 4. (a) Optical power versus current (L – I
Fig. 5. Optical spectrum of the OCMLLD in the mode-lock state; central wavelength, 1558 nm; span, 30 nm; inset shows the frequency mode spacing; resolution is 0.02 nm.
Fig. 6. Electrical spectrum of the OCMLLD; center frequency, 15 GHz; span, 30 GHz; resolution bandwidth (RBW), 1 MHz; video bandwidth (VBW), 1 MHz.
Fig. 7. (a) Pulsewidth versus gain section current level at fixed V SA I SOA

Set citation alerts for the article
Please enter your email address
© Copyright 2018-2021 | Chinese Laser Press. All Rights Reserved 沪ICP备15018463号-20