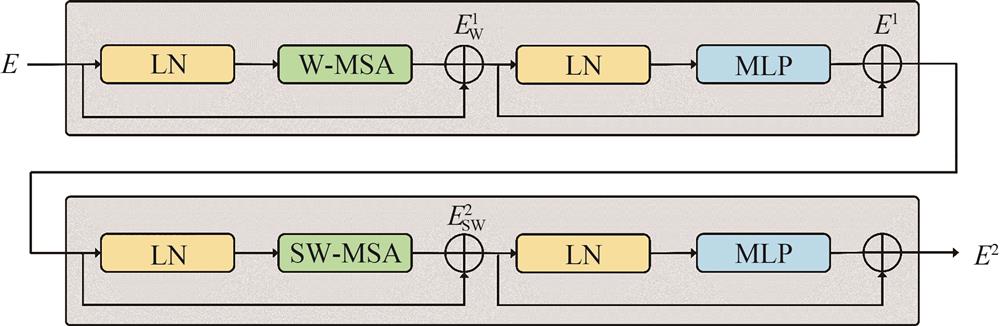
Fig. 1. Flowchart of two successive STBs
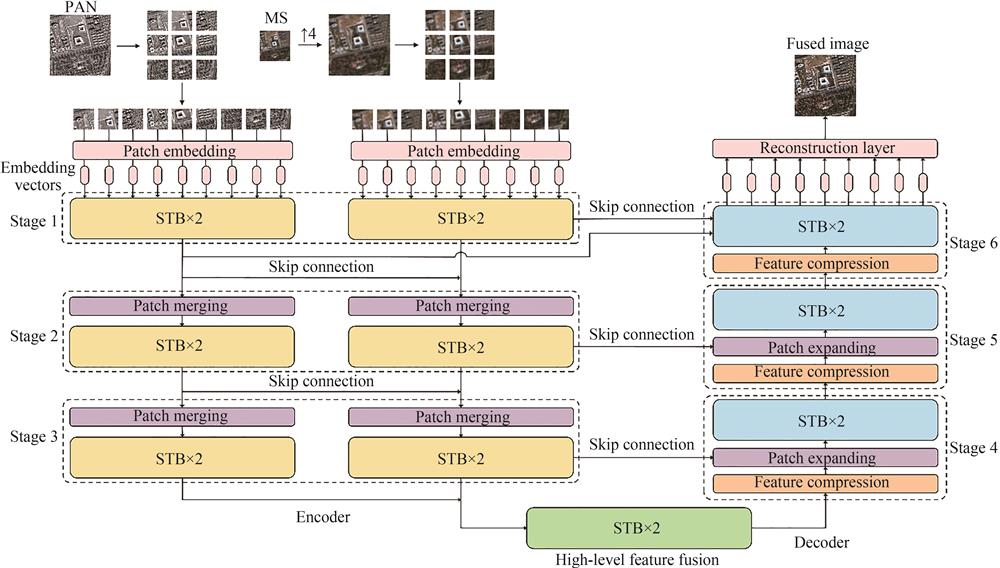
Fig. 2. The overall network architecture
Fig. 3. Schematic of different modules in the decoder
Fig. 4. Comparison on fusion performance and computational complexity of the model variants
Fig. 5. Reduced-resolution GF2 testing images and fusion results of different methods
Fig. 6. Residual maps between the fusion results on the GF2 testing images and the reference image
Fig. 7. Reduced-resolution QB testing images and fusion results of different methods
Fig. 8. Residual maps between the fusion results on the QB testing images and the reference image
Fig. 9. Reduced-resolution WV3 testing images and fusion results of different methods
Fig. 10. Residual maps between the fusion results on the WV3 testing images and the reference image
Fig. 11. Full-resolution GF2 testing images and fusion results of different methods
Fig. 12. The visualization of multi-level feature maps output by the encoder in each stage
| Variant | C | P | GF2 | QB | WV3 |
|---|
| SAM | ERGAS | sCC | Q4 | SAM | ERGAS | sCC | Q4 | SAM | ERGAS | sCC | Q8 |
|---|
| p8 | 128 | 8 | 0.725 7 | 0.597 2 | 0.991 8 | 0.985 1 | 0.979 8 | 0.797 1 | 0.990 4 | 0.977 7 | 2.565 6 | 1.577 8 | 0.990 6 | 0.975 2 | | c96 | 96 | 4 | 0.736 6 | 0.574 9 | 0.991 6 | 0.986 2 | 0.943 0 | 0.767 0 | 0.990 3 | 0.981 5 | 2.355 7 | 1.419 4 | 0.992 6 | 0.979 5 | | Proposed | 128 | 4 | 0.713 2 | 0.564 3 | 0.992 1 | 0.986 7 | 0.865 4 | 0.691 3 | 0.992 8 | 0.984 1 | 2.276 9 | 1.369 5 | 0.993 1 | 0.980 6 | | c192 | 192 | 4 | 0.692 4 | 0.558 0 | 0.992 5 | 0.987 7 | 0.770 4 | 0.618 9 | 0.994 9 | 0.986 4 | 2.185 1 | 1.312 5 | 0.993 5 | 0.981 5 | | Ideal | | | 0 | 0 | 1 | 1 | 0 | 0 | 1 | 1 | 0 | 0 | 1 | 1 |
|
Table 1. Comparison on fused results of different model variants
| Method | GF2 | QB | WV3 |
|---|
| SAM | ERGAS | sCC | Q4 | SAM | ERGAS | sCC | Q4 | SAM | ERGAS | sCC | Q8 |
|---|
| BDSD | 2.120 3 | 2.596 4 | 0.886 4 | 0.800 9 | 1.480 0 | 1.076 1 | 0.980 1 | 0.967 6 | 4.137 1 | 2.820 5 | 0.964 4 | 0.941 3 | | GSA | 2.090 3 | 2.671 8 | 0.876 1 | 0.781 6 | 1.470 8 | 1.062 3 | 0.977 2 | 0.968 2 | 3.792 9 | 2.586 3 | 0.963 3 | 0.946 7 | | MTF-GLP-HPM | 2.041 5 | 3.022 3 | 0.850 8 | 0.743 7 | 1.435 8 | 1.072 6 | 0.979 4 | 0.966 7 | 3.922 1 | 3.493 8 | 0.928 7 | 0.943 4 | | SR-D | 1.774 5 | 1.843 3 | 0.919 9 | 0.875 8 | 1.519 5 | 1.232 8 | 0.970 7 | 0.959 7 | 3.681 9 | 2.774 5 | 0.956 5 | 0.931 6 | | PNN | 1.191 0 | 0.954 6 | 0.974 2 | 0.963 3 | 1.142 5 | 0.907 6 | 0.985 2 | 0.973 9 | 2.878 9 | 1.749 6 | 0.986 2 | 0.970 7 | | RSIFNN | 1.160 5 | 1.003 7 | 0.970 9 | 0.959 9 | 1.206 2 | 1.016 4 | 0.980 6 | 0.968 1 | 2.902 1 | 1.743 8 | 0.985 6 | 0.970 8 | | PSGAN | 0.777 2 | 0.582 9 | 0.990 5 | 0.985 4 | 0.945 1 | 0.725 3 | 0.991 5 | 0.982 6 | 2.555 7 | 1.579 2 | 0.990 3 | 0.974 8 | | NLRNet | 0.834 9 | 0.625 9 | 0.988 8 | 0.983 1 | 0.977 9 | 0.753 8 | 0.990 5 | 0.981 3 | 2.513 9 | 1.511 5 | 0.990 9 | 0.976 5 | | PanColorGAN | 0.961 3 | 0.686 3 | 0.990 1 | 0.984 5 | 1.096 9 | 0.863 8 | 0.991 1 | 0.983 3 | 2.469 6 | 1.462 1 | 0.992 0 | 0.977 6 | | Proposed | 0.713 2 | 0.564 3 | 0.992 1 | 0.986 7 | 0.865 4 | 0.691 3 | 0.992 8 | 0.984 1 | 2.276 9 | 1.369 5 | 0.993 1 | 0.980 6 | | Ideal | 0 | 0 | 1 | 1 | 0 | 0 | 1 | 1 | 0 | 0 | 1 | 1 |
|
Table 2. Quantitative comparison on fused results of different methods at reduced resolution
| Method | GF2 | QB | WV3 |
|---|
| Dλ | DS | HQNR | Dλ | DS | HQNR | Dλ | DS | HQNR |
|---|
| BDSD | 0.088 4 | 0.224 6 | 0.707 2 | 0.058 4 | 0.023 5 | 0.919 5 | 0.081 1 | 0.041 2 | 0.881 0 | | GSA | 0.203 7 | 0.324 3 | 0.544 8 | 0.057 5 | 0.039 4 | 0.905 5 | 0.061 6 | 0.051 7 | 0.890 0 | | MTF-GLP-HPM | 0.048 0 | 0.237 1 | 0.726 7 | 0.021 2 | 0.037 5 | 0.942 1 | 0.029 5 | 0.044 2 | 0.927 5 | | SR-D | 0.014 8 | 0.035 6 | 0.950 0 | 0.022 4 | 0.026 3 | 0.951 9 | 0.026 9 | 0.030 4 | 0.943 6 | | PNN | 0.012 8 | 0.046 8 | 0.941 0 | 0.028 5 | 0.013 9 | 0.958 0 | 0.036 6 | 0.024 3 | 0.940 1 | | RSIFNN | 0.014 6 | 0.090 5 | 0.896 3 | 0.018 7 | 0.014 1 | 0.967 5 | 0.029 6 | 0.022 8 | 0.948 3 | | PSGAN | 0.010 9 | 0.018 0 | 0.971 3 | 0.017 7 | 0.028 5 | 0.954 3 | 0.038 7 | 0.025 0 | 0.937 4 | | NLRNet | 0.012 4 | 0.016 8 | 0.971 1 | 0.032 0 | 0.013 8 | 0.954 6 | 0.041 6 | 0.023 4 | 0.935 9 | | PanColorGAN | 0.021 8 | 0.015 6 | 0.963 0 | 0.022 4 | 0.015 6 | 0.962 4 | 0.032 3 | 0.026 6 | 0.941 9 | | Proposed | 0.009 6 | 0.014 7 | 0.975 9 | 0.021 7 | 0.010 4 | 0.968 1 | 0.036 2 | 0.012 8 | 0.951 5 | | Ideal | 0 | 0 | 1 | 0 | 0 | 1 | 0 | 0 | 1 |
|
Table 3. Quantitative comparison on fused results of different methods at full resolution
| Method | Runtime/s | Parameters |
|---|
| BDSD | 0.012 1 | - | | GSA | 0.006 7 | - | | MTF-GLP-HPM | 0.027 9 | - | | SR-D | 0.188 4 | - | | PNN | 0.001 3 | 0.080×10⁶ | | RSIFNN | 0.002 5 | 0.338×10⁶ | | PSGAN | 0.011 1 | 1.888×10⁶ | | NLRNet | 0.014 8 | 4.850×10⁶ | | PanColorGAN | 0.053 7 | 32.617×10⁶ | | Proposed | 0.023 4 | 58.571×10⁶ |
|
Table 4. Comparison on runtimes and parameters of different methods