
Simo Wang, Fanxing Li, Fuping Peng, Jialin Du, Wei Yan. Microspacing Measurement Based on Spectral Focusing Characteristics of Binary Optical Lens[J]. Acta Optica Sinica, 2020, 40(2): 0212003
- Acta Optica Sinica
- Vol. 40, Issue 2, 0212003 (2020)
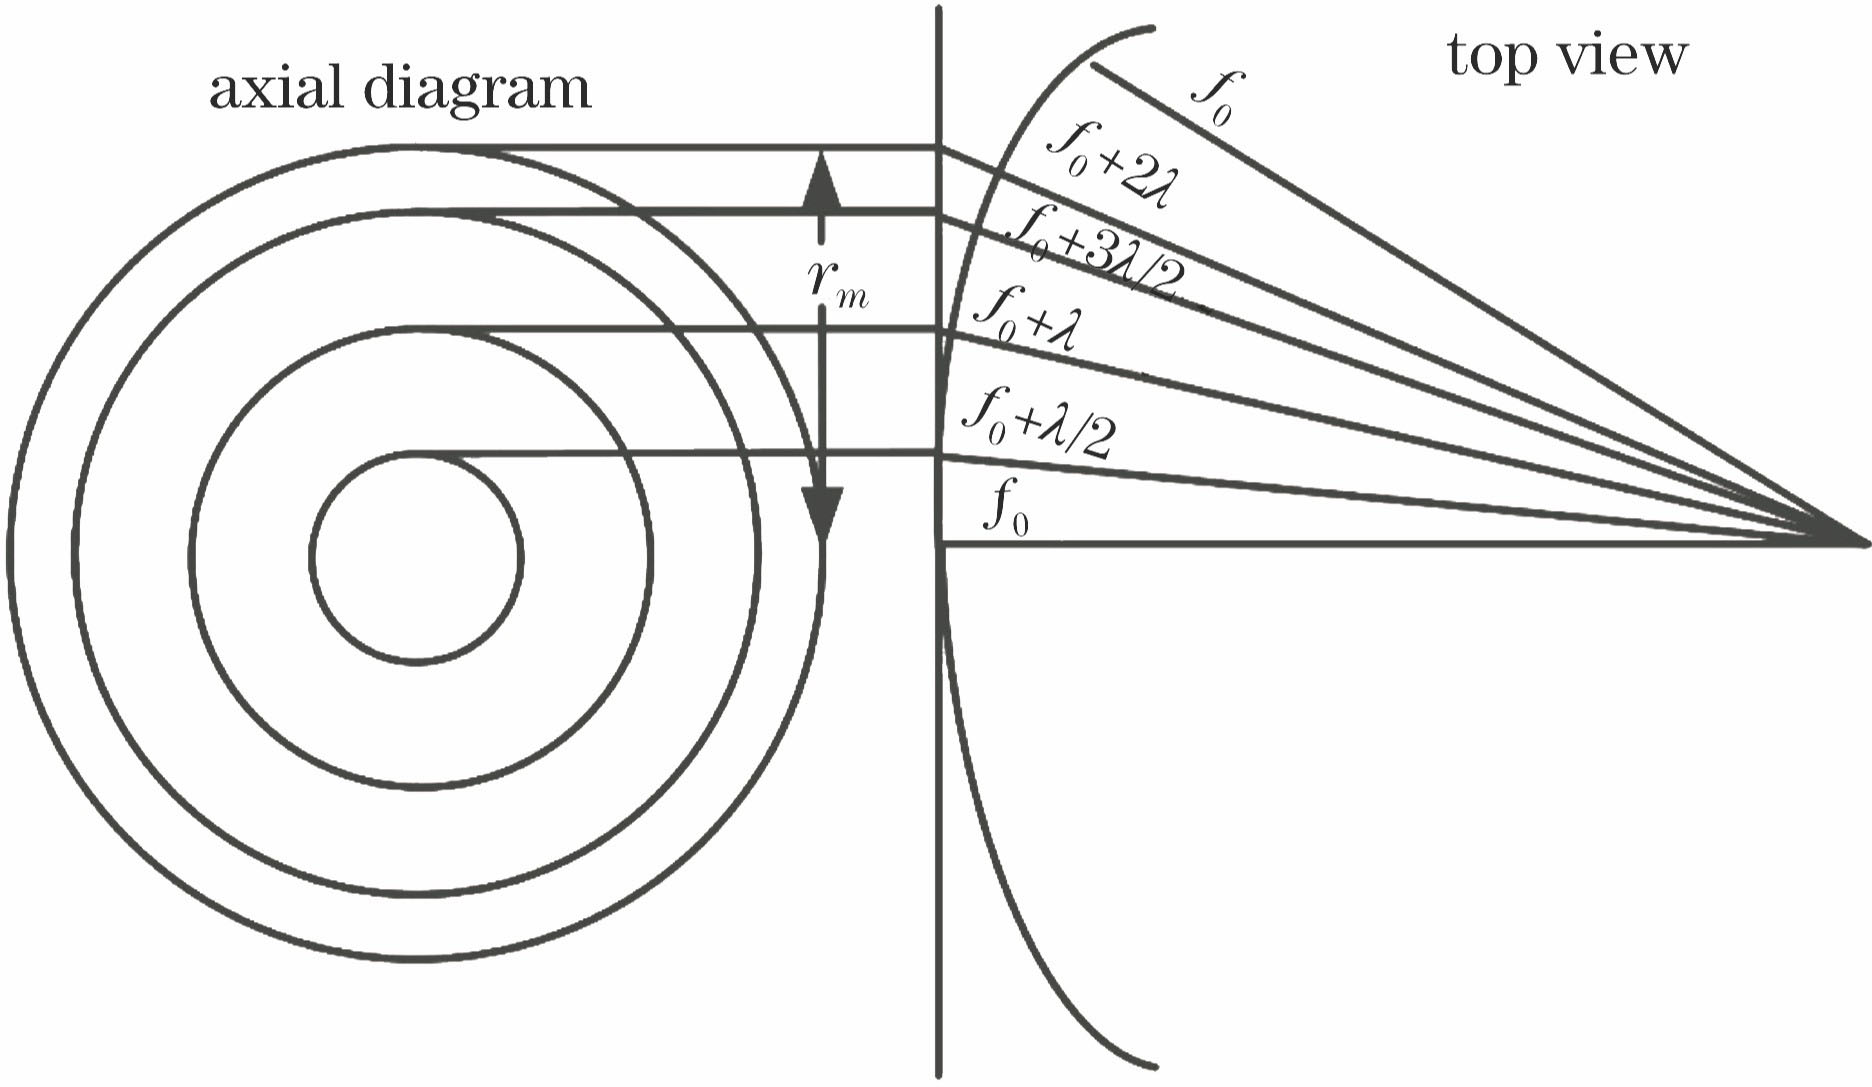
Fig. 1. Axial and side views of binary optical lens
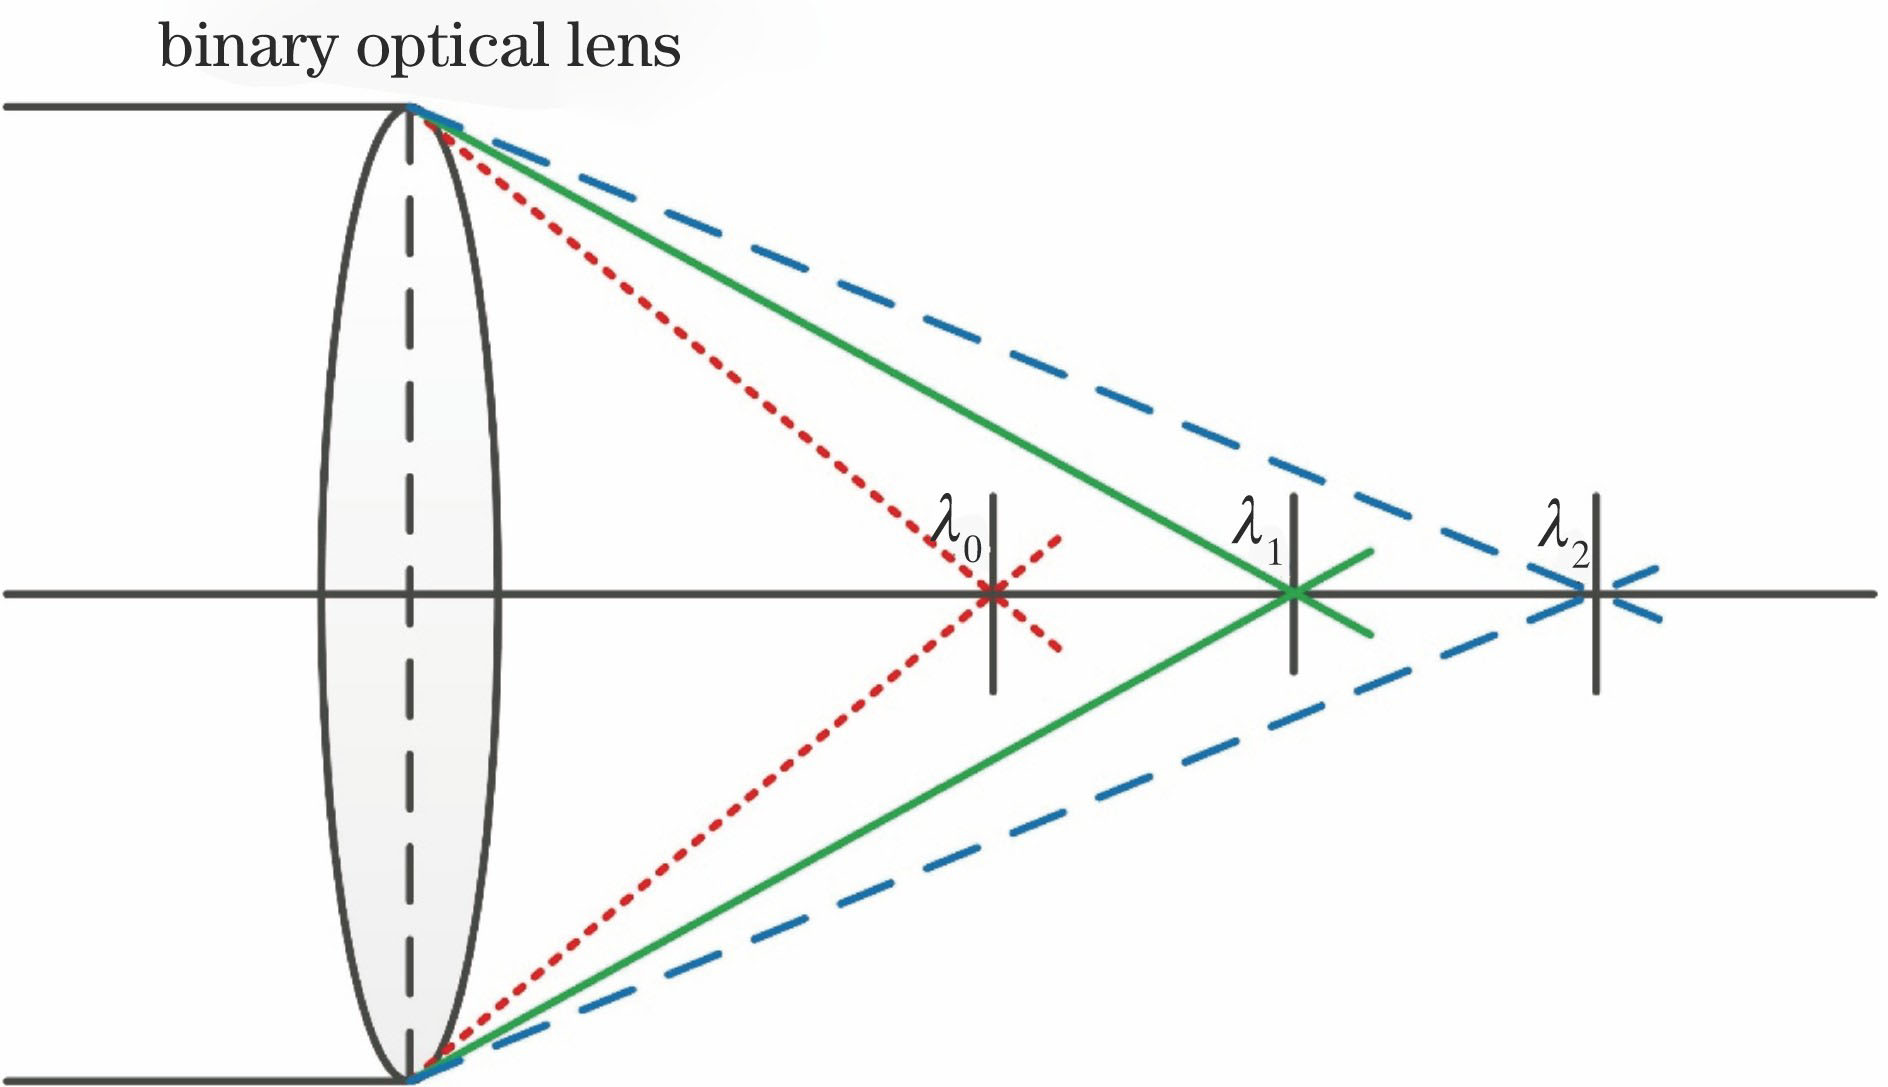
Fig. 2. Schematic of axial dispersion of binary optical lens
Fig. 3. Schematic of spectral confocal micro-spacing measurement of binary optical lens
Fig. 4. Diffraction images when image screen is at different locations from binary optical lens. (a) 20 mm; (b) 40 mm; (c) 50 mm; (d) 60 mm; (e) 80 mm
Fig. 5. Intensity distributions when image screen is at different locations from binary optical lens. (a) 20 mm; (b) 40 mm; (c) 50 mm; (d) 60 mm; (e) 80 mm
Fig. 6. Diffraction patterns under different incident light wavelengths when distances between light screen and binary optical lens are different. From top to bottom, distances between light screen and binary optical lens are 42.969, 46.610, 50.000, and 55.000 mm, respectively. From left to right, incident light wavelengths are 500, 550, 590, and 640 nm, respectively
Fig. 7. Original spectrum of spectrometer
Fig. 8. Spectra received by spectrometer at different locations
Fig. 9. Focal position of incident light with different wavelengths corresponds to axial coordinate of three-dimensional translation stage
Fig. 10. Measured optical disc
Fig. 11. Spectra of two adjacent thin films of optical disc

Set citation alerts for the article
Please enter your email address
© Copyright 2018-2021 | Chinese Laser Press. All Rights Reserved 沪ICP备15018463号-20