
Xiaodi Wang, Yuyan Cao, Fuguo Wang, Hongliang Chu, Yanwei Li. Optimization design of large-aperture lens mixed flexible support structure[J]. Infrared and Laser Engineering, 2022, 51(6): 20210670
- Infrared and Laser Engineering
- Vol. 51, Issue 6, 20210670 (2022)
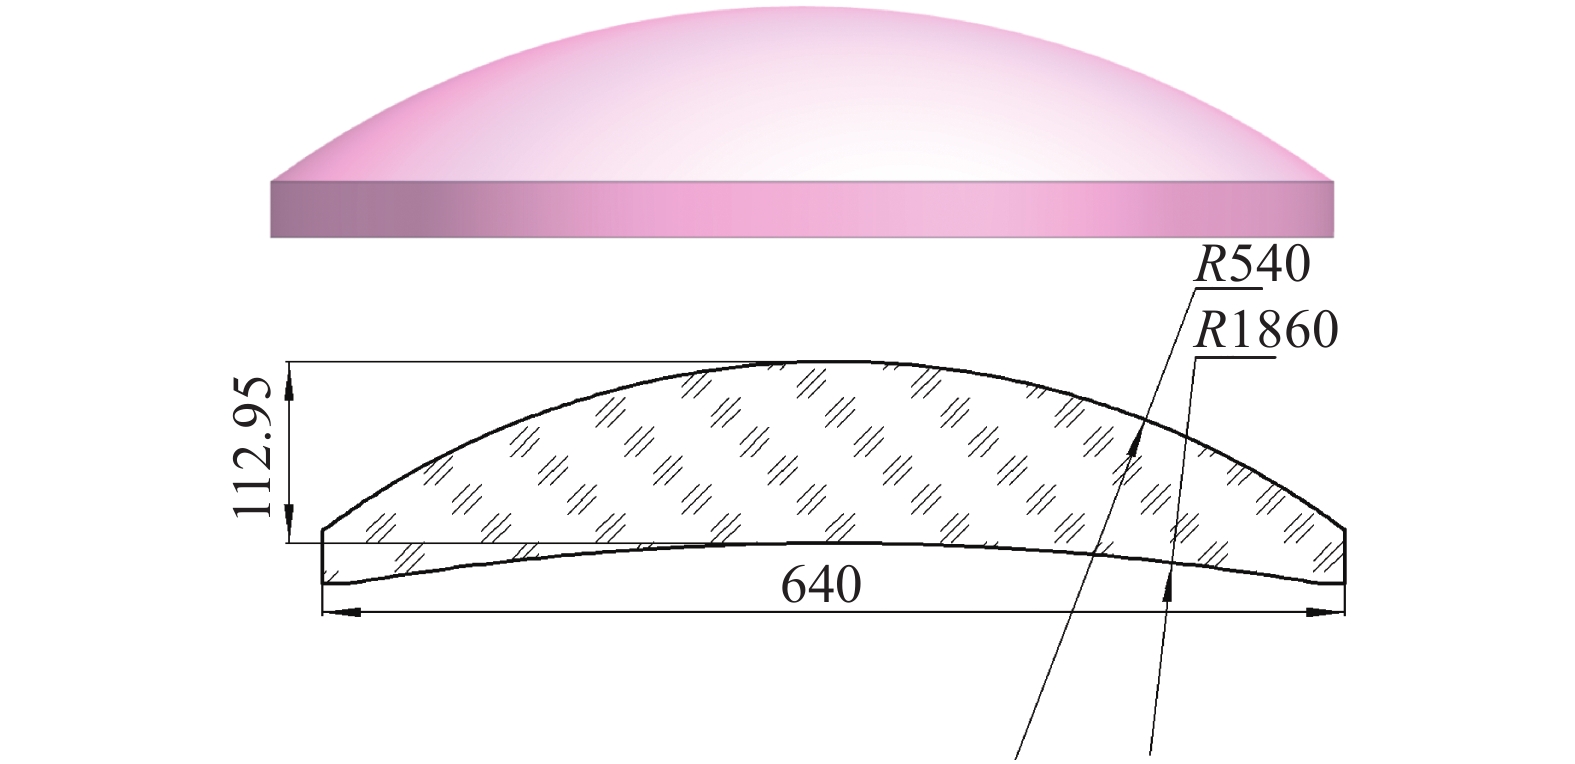
Fig. 1. Lens shape and dimension parameters
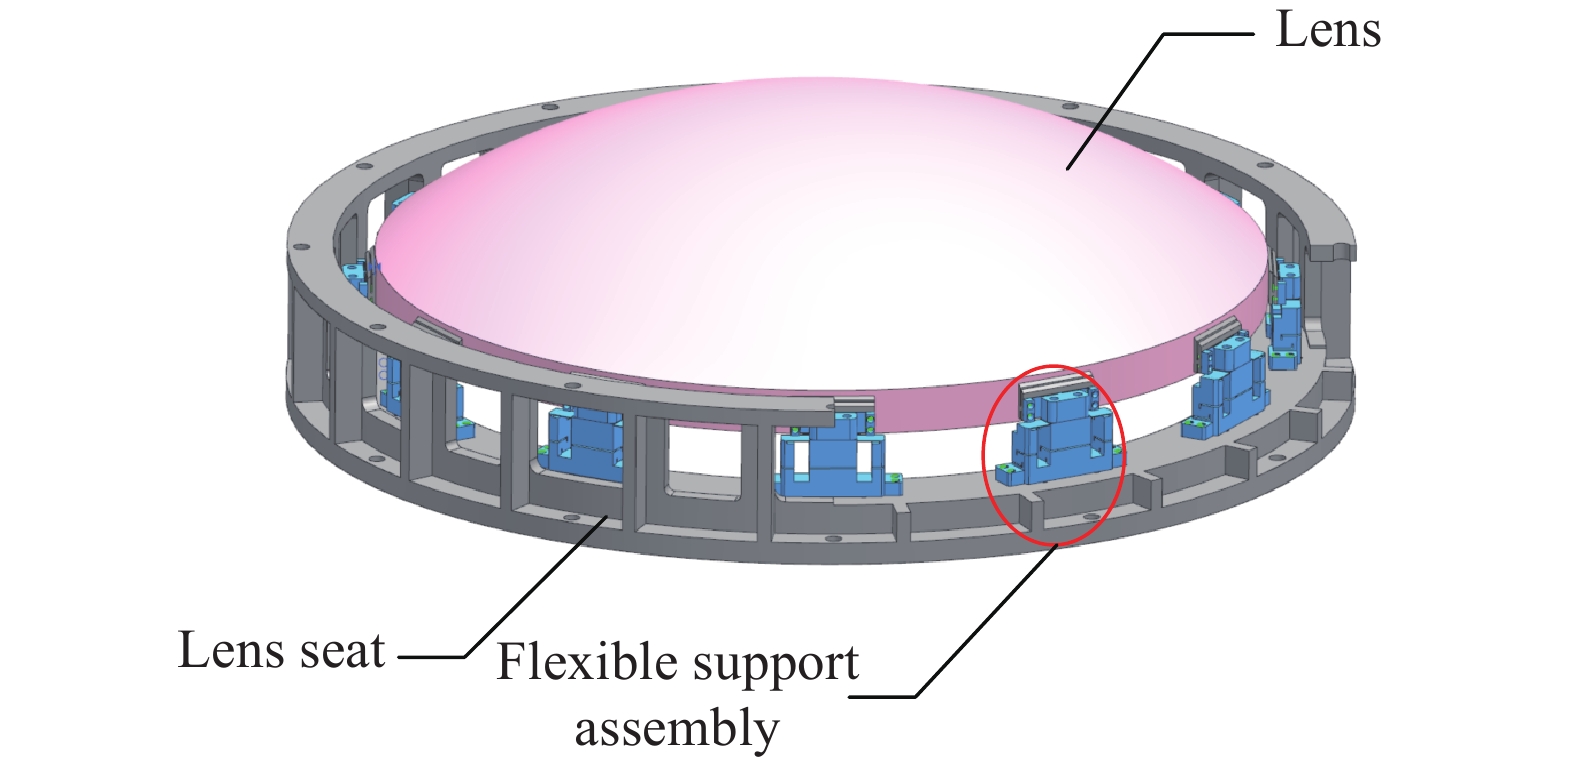
Fig. 2. Schematic diagram of the overall structure of lens assembly
Fig. 3. Lens support assembly and its structural parts
Fig. 4. Schematic diagram of flexible hinge structure
Fig. 5. Schematic diagram of force analysis of flexure hinge
Fig. 6. Schematic diagram of equivalent analysis of elastic sheet flexure hinge
Fig. 7. Equal mechanical model for flexible supports in the X -axis direction
Fig. 8. Relationship between flexibility C x and design parameters
柔度
随各设计参数间的变化关系
Fig. 9. Radial flexible support structure and its finite element model
Fig. 10. Test test equipment
Fig. 11. Mesh division
Fig. 12. Simulation results under various working conditions
Fig. 13. The first three order mode shapes of the lens assembly
Fig. 14. Schematic diagram of spherical data fitting principle
Fig. 15. Static surface cloud map of the upper surface of the lens
|
Table 1. Material properties
|
Table 2. Optimization results of flexure hinge support structure
| ||||||||||||||||||||||||||||||||||||||||||||||||||||||||||||||||||||||||||||||||||||||||||||||
Table 3. Comparison of theoretical stiffness (An) and FEA of radial flexible support structure
| ||||||||||||||||||||||
Table 4. Comparison of theoretical (An) and teststiffness (Ex) of radial flexible support structures
|
Table 5. Deformation and displacement data of lens statics simulation under various working conditions
|
Table 6. Modal analysis results of lens subassembly
|
Table 7. Analysis results of surface precision on lens assembly

Set citation alerts for the article
Please enter your email address
© Copyright 2018-2021 | Chinese Laser Press. All Rights Reserved 沪ICP备15018463号-20