
Jingli Gao, Difa Ye, Jie Liu, Wei Kang. Transition of the generation mechanism of high-order harmonics in an extended neon system[J]. Matter and Radiation at Extremes, 2022, 7(4): 044403
- Matter and Radiation at Extremes
- Vol. 7, Issue 4, 044403 (2022)
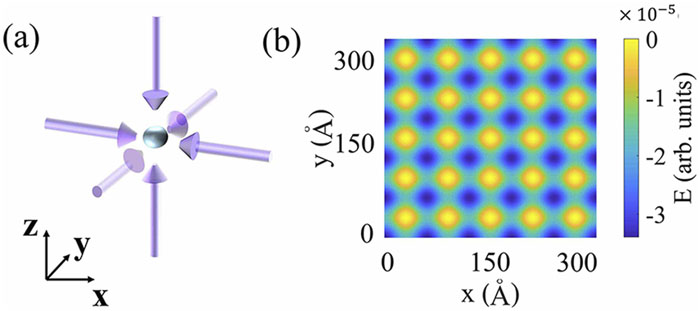
Fig. 1. (a) Schematic illustration of the laser configuration to form a simple cubic optical lattice. (b) Top view (x –y plane) of the simple cubic lattice.
![(a) High-order harmonic spectrum of an isolated Ne atom, with the shape of the driving pulse displayed in the inset. (b) High-order harmonic spectrum of Ne in a simple cubic extended system with a number density 3.91 × 1018 cm−3, corresponding to a lattice constant d = 120 bohrs (63.5 Å). The pulse polarization is along the [100] direction. The vertical blue dashed line in (a) and (b) indicates the cutoff energy of high-order harmonics in an isolated Ne atom. The inset in (b) shows the generation of a pair of attosecond pulses, and the energy window is between 158.2 and 300 eV, shown by the vertical red dashed lines. The red arrow shows the bandgap energy of the extended system. The green arrows indicate the peak positions of the two platforms beyond the atomic limit. (c) and (d) Time–frequency analyses of the high-order harmonics in (a) and (b), respectively, where the unit of time is one oscillating cycle (o.c.) of the driving laser pulse, displayed at the top of (c) and (d).](/richHtml/MRE/2022/7/4/044403/img_2.jpg)
Fig. 2. (a) High-order harmonic spectrum of an isolated Ne atom, with the shape of the driving pulse displayed in the inset. (b) High-order harmonic spectrum of Ne in a simple cubic extended system with a number density 3.91 × 1018 cm−3, corresponding to a lattice constant d = 120 bohrs (63.5 Å). The pulse polarization is along the [100] direction. The vertical blue dashed line in (a) and (b) indicates the cutoff energy of high-order harmonics in an isolated Ne atom. The inset in (b) shows the generation of a pair of attosecond pulses, and the energy window is between 158.2 and 300 eV, shown by the vertical red dashed lines. The red arrow shows the bandgap energy of the extended system. The green arrows indicate the peak positions of the two platforms beyond the atomic limit. (c) and (d) Time–frequency analyses of the high-order harmonics in (a) and (b), respectively, where the unit of time is one oscillating cycle (o.c.) of the driving laser pulse, displayed at the top of (c) and (d).
Fig. 3. Energy distribution of an ionized electron at the moment when it arrives at the nearest-neighbor (NN) ion, shown as the green curve, and the next-nearest-neighbor (NNN) ion, shown as the purple curve. The total distribution is shown as the orange curve. The distribution is calculated using a semiclassical model with d = 120 bohrs (63.5 Å). The driving laser is assumed to be monochromatic with an intensity of 500 TW/cm2 at λ L = 8000 Å.
Fig. 4. High-order harmonic spectra for different ionic densities, showing the transition of the HHG mechanism from an isolated Ne (d), to an extended system of solid density (a). The black dashed lines indicate the maximum energy edge of 250 eV. Calculations were performed by the TDDFT method. The laser intensity for the calculations was 500 TW/cm2 and the wavelength was 8000 Å. The pulse duration was 16 fs.
Fig. 5. Energy of a wandering electron at the end of the first, second, and third oscillating cycles of the driving laser, plotted as a function of the time at which it is ionized T I in the first oscillating cycle of the laser field. The laser configuration is the same as that in Fig. 3 .
Fig. 6. Band structure (solid curves) of Ne in a simple cubic lattice with a solid density, corresponding to d = 5.75 bohrs (3 Å), compared with the band structure of an free electron (dotted curves). The two band structures are similar, as a result of weak van der Waals interaction between Ne atoms.
Fig. 7. Laser intensity dependence of the high-order harmonic energy edge calculated at an Ne density of 3.91 × 1018 cm−3, corresponding to d = 120 bohrs (63.5 Å). The atomic limit and the new limit of 8U p + I p are displayed as dotted lines for comparison.
Fig. 8. (a) High-order harmonic spectrum of a sin3.7(ω /T )-shaped pulse, as displayed in the inset. The carrier envelope phase ϕ 0 = 3π /2, and the duration of the pulse T = 13.33 fs. (b) IAP generated in the energy window from 140 to 300 eV [shown by the vertical dotted lines in (a)]. The laser intensity is 500 TW/cm2, and the pulse polarization is along the [100] direction. The width of the IAP is about 57 as.
Fig. 9. Selection of direction of polarization in a simple cubic lattice with d = 120 bohrs (63.5 Å). (a)–(c) High-order harmonic spectra generated by a laser with direction of polarization along the [100], [110], and [111] directions, respectively. High-order harmonics beyond the atomic limit can only be observed in the [100] direction.

Set citation alerts for the article
Please enter your email address
© Copyright 2018-2021 | Chinese Laser Press. All Rights Reserved 沪ICP备15018463号-20