• Laser & Optoelectronics Progress
  • Vol. 57, Issue 19, 193002 (2020)
Lijian Pan, Weifang Chen*, Rongfang Cui, and Miaomiao Li
Author Affiliations
  • College of Mechanical and Electrical Engineering, Nanjing University of Aeronautics and Astronautics, Nanjing, Jiangsu 210001, China
  • show less
    DOI: 10.3788/LOP57.193002 Cite this Article Set citation alerts
    Lijian Pan, Weifang Chen, Rongfang Cui, Miaomiao Li. Quantitative Analysis of Aluminum Alloy Based on Laser-Induced Breakdown Spectroscopy and Radial Basis Function Neural Network[J]. Laser & Optoelectronics Progress, 2020, 57(19): 193002 Copy Citation Text show less
    Structure of neural network
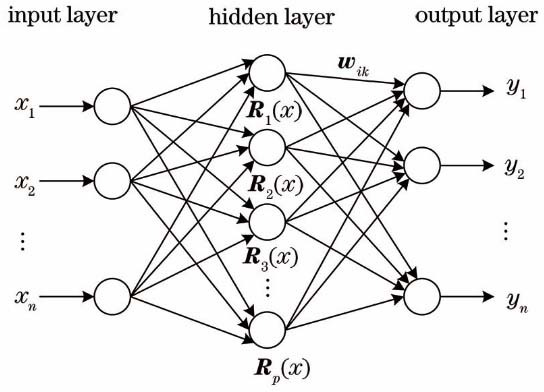
    Fig. 1. Structure of neural network
    Schematic of LIBS experimental system
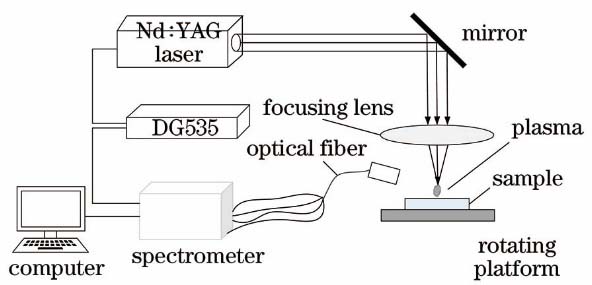
    Fig. 2. Schematic of LIBS experimental system
    LIBS spectrum of aluminum alloy
    Fig. 3. LIBS spectrum of aluminum alloy
    Univariate linear calibration curves of five main nonaluminum elements. (a) Mg; (b) Si; (c) Fe; (d) Mn; (e) Cu
    Fig. 4. Univariate linear calibration curves of five main nonaluminum elements. (a) Mg; (b) Si; (c) Fe; (d) Mn; (e) Cu
    Effect of vspread on the performance of RBF model
    Fig. 5. Effect of vspread on the performance of RBF model
    Prediction of five main nonaluminum elements by RBF neural networks. (a) Mg; (b) Si; (c) Fe; (d) Mn; (e) Cu
    Fig. 6. Prediction of five main nonaluminum elements by RBF neural networks. (a) Mg; (b) Si; (c) Fe; (d) Mn; (e) Cu
    StandardsampleMass fraction /%
    SiFeCuMnMg
    30030.1350.3840.15801.07000.013
    50520.1200.1500.00300.00602.560
    50830.0440.0860.00090.61704.220
    59620.5870.3920.08300.41703.410
    59630.2790.6500.11700.21504.720
    60610.6400.5460.29000.09401.000
    6063a0.3900.1350.00250.00360.825
    6063b0.4190.1870.07100.05500.540
    Table 1. Content of main non-Al elements in different standard samples of aluminum alloy
    ElementAnalytical spectral line /nm
    Al281.61, 305.01, 308.21, 358.64, 396.17
    Mn257.55, 259.37, 263.21, 279.48
    Mg277.99, 279.06, 280.25, 285.21
    Fe234.33, 238.18, 302.05
    Si288.15, 390.55
    Cu324.73, 327.41
    Table 2. Spectral lines for analysis
    ElementRMSE /%R2
    LinearcalibrationRBFLinearcalibrationRBF
    Si8.100.180.7410.959
    Fe7.490.330.7810.968
    Cu7.740.130.7640.972
    Mn7.970.360.9730.995
    Mg5.520.550.9860.994
    Table 3. Quantitative analysis results calculated by different models for standard samples of aluminum alloy
    Lijian Pan, Weifang Chen, Rongfang Cui, Miaomiao Li. Quantitative Analysis of Aluminum Alloy Based on Laser-Induced Breakdown Spectroscopy and Radial Basis Function Neural Network[J]. Laser & Optoelectronics Progress, 2020, 57(19): 193002
    Download Citation