
Zhonghe Ren, Meiping Wu, Youhong Tang, Jitai Han, Yuling Gong. Numerical Simulation and Experimental Research of Laser Cladding Based on Thermo-Mechanical Coupling[J]. Laser & Optoelectronics Progress, 2019, 56(5): 051404
- Laser & Optoelectronics Progress
- Vol. 56, Issue 5, 051404 (2019)
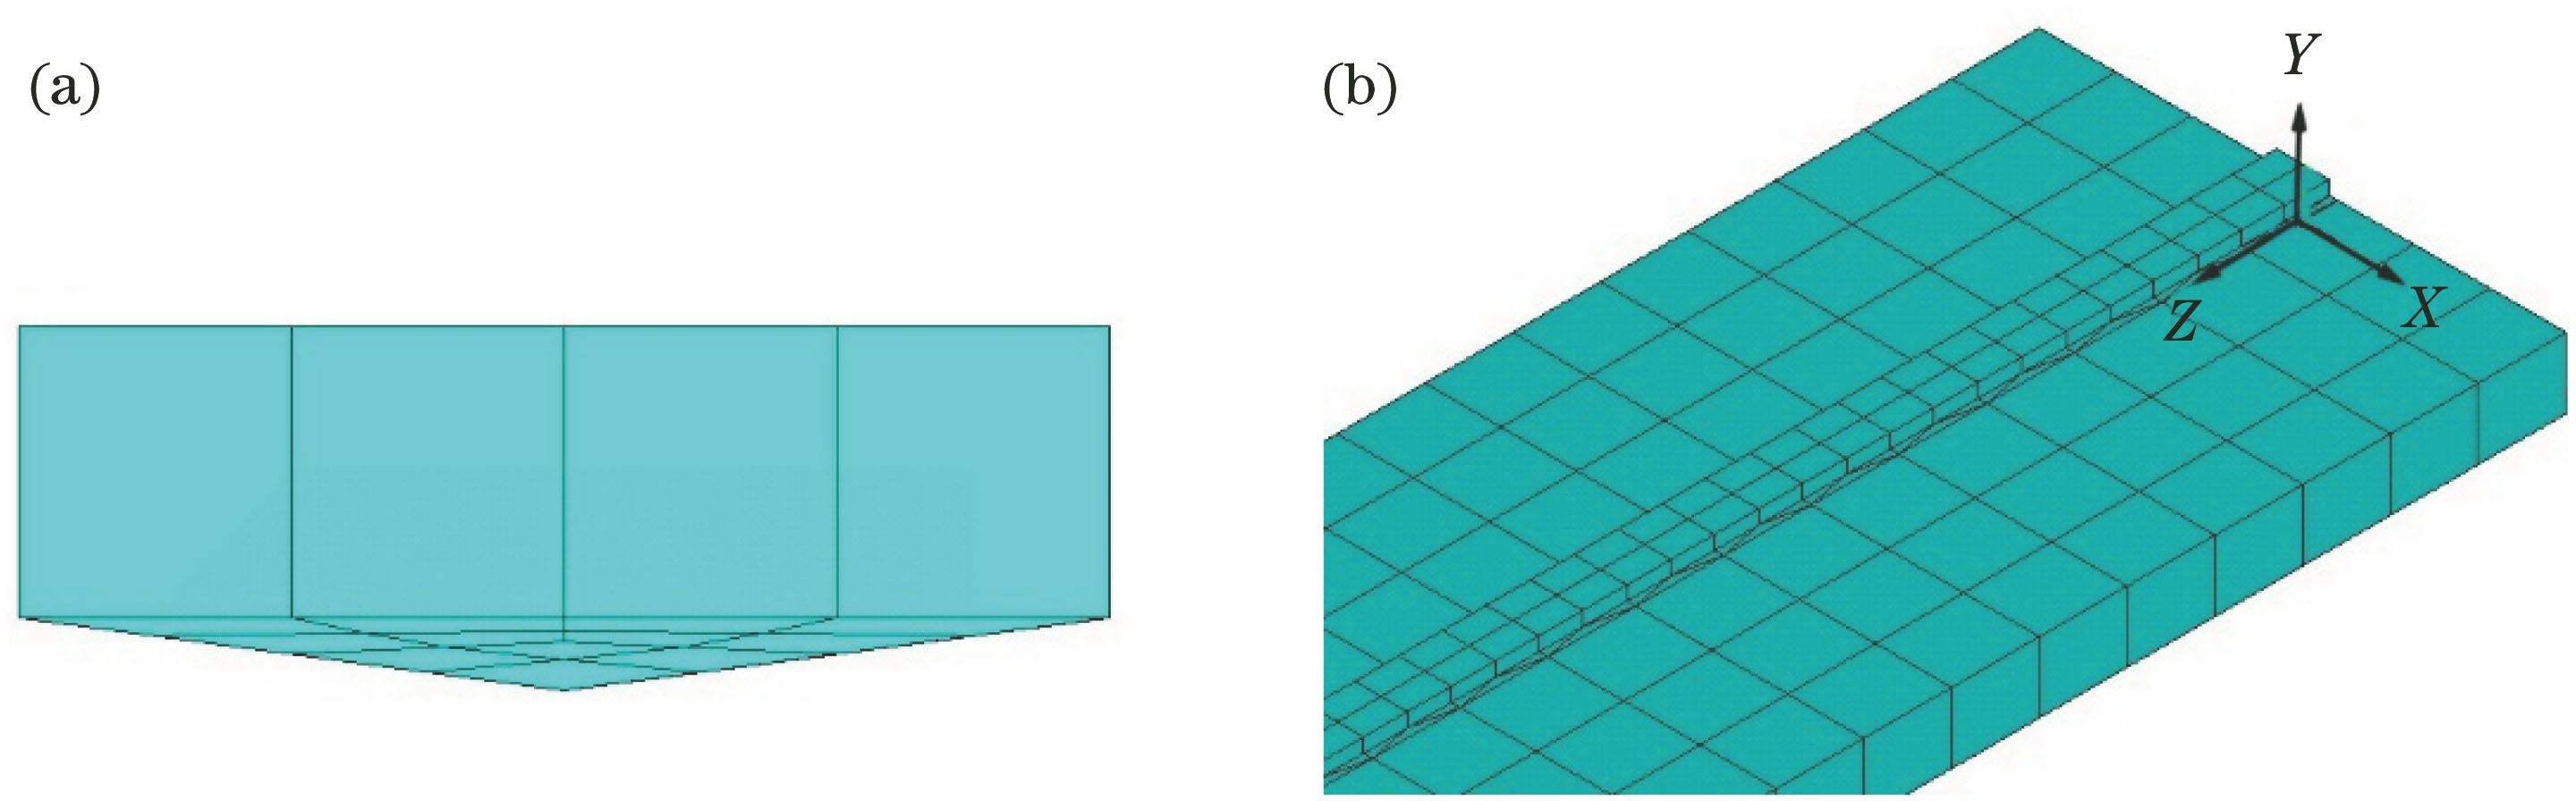
Fig. 1. Cross section of cladding layer and meshing. (a) Cross section of cladding layer; (b) meshing
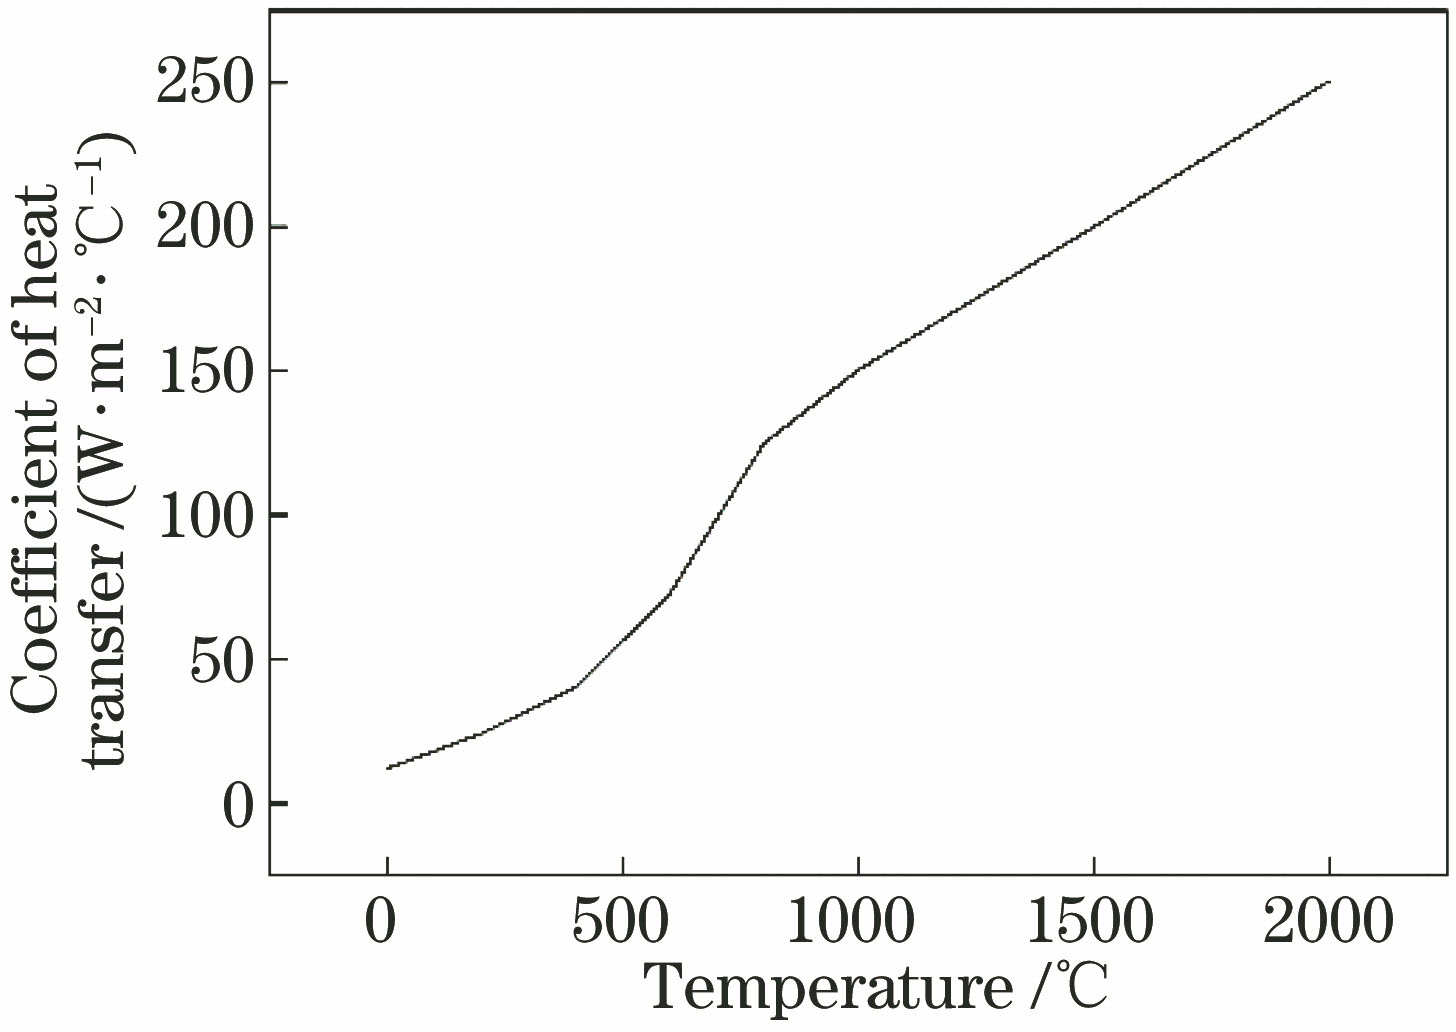
Fig. 2. Comprehensive coefficient of heat transfer varing with temperature
Fig. 3. Geometry diagram of cross section of laser cladding layer
Fig. 4. Comparison between temperature field and metallographic structure of test piece
Fig. 5. Temperature fields of laser cladding. (a) Initial; (b) middle; (c) final; (d) cooling after 20 s
Fig. 6. Curves of temperature versus time
Fig. 7. Von Mises stress nephogram and displacement nephogram. (a) Von Mises stress; (b) displacement
Fig. 8. Stress distribution curves along different paths. (a) Along the Z axis in the middle of the bonding surface of the cladding layer and the matrix; (b) along the X axis in the middle of the matrix undersurface; (c) along the Y axis in the middle of the free end
Fig. 9. Temperature-time curves for different laser processing parameters. (a) Group A; (b) group B; (c) group C; (d) group D; (e) group E; (f) group F
Fig. 10. Stress distribution curves of different laser processing parameters along path 1
Fig. 11. Morphology of laser cladding specimens. (a) Front; (b) back
Fig. 12. Deformation of cladding specimens. (a) Photos; (b) deformation comparison
|
Table 1. The maximum temperature of model temperature field under different meshes
|
Table 2. Grouping and calculation results of laser process parameters

Set citation alerts for the article
Please enter your email address
© Copyright 2018-2021 | Chinese Laser Press. All Rights Reserved 沪ICP备15018463号-20