Author Affiliations
1 School of Electrical Engineering, University of South China, Hengyang, Hunan 421001, China2 Hunan Provincial Key Laboratory for Ultra-Fast Micro/Nano Technology and Advanced Laser Manufacture, University of South China, Hengyang, Hunan 421001, Chinashow less
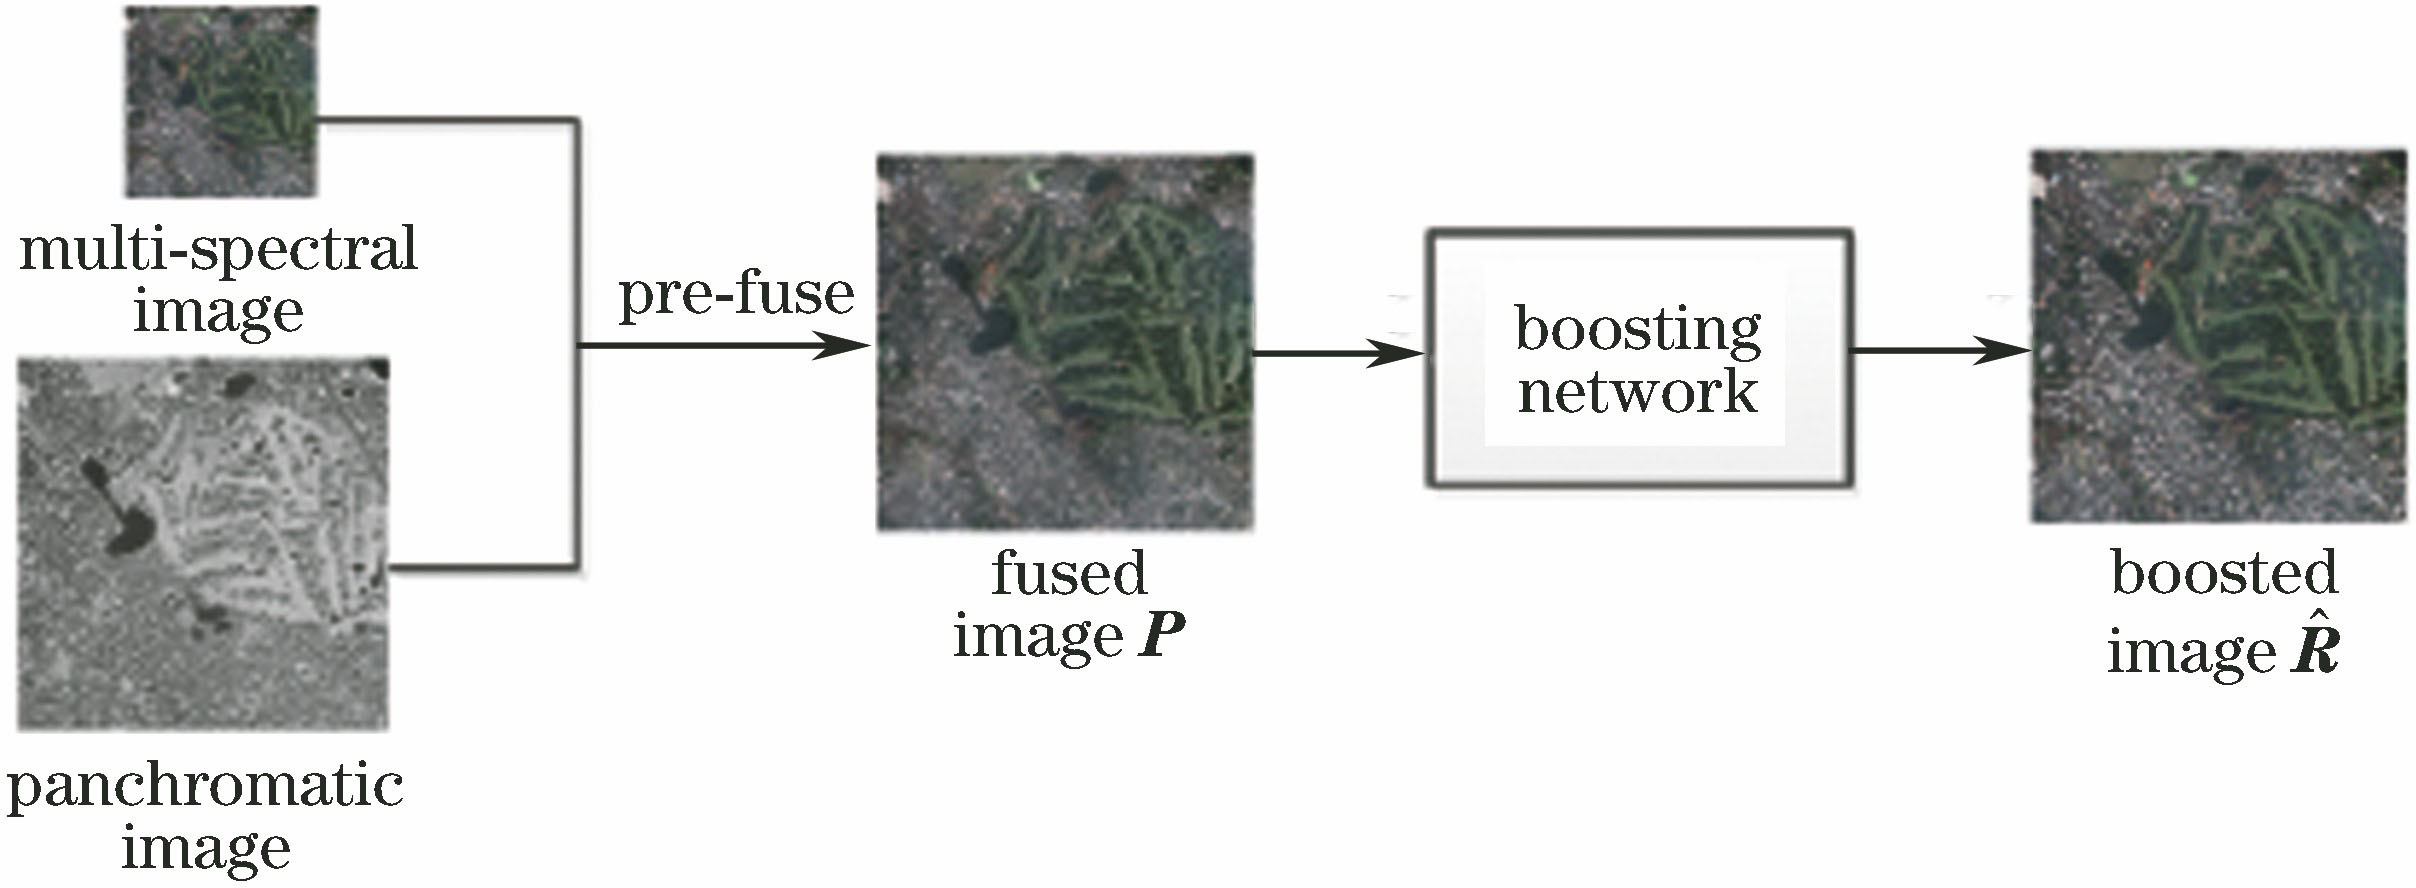
Fig. 1. Framework of proposed method
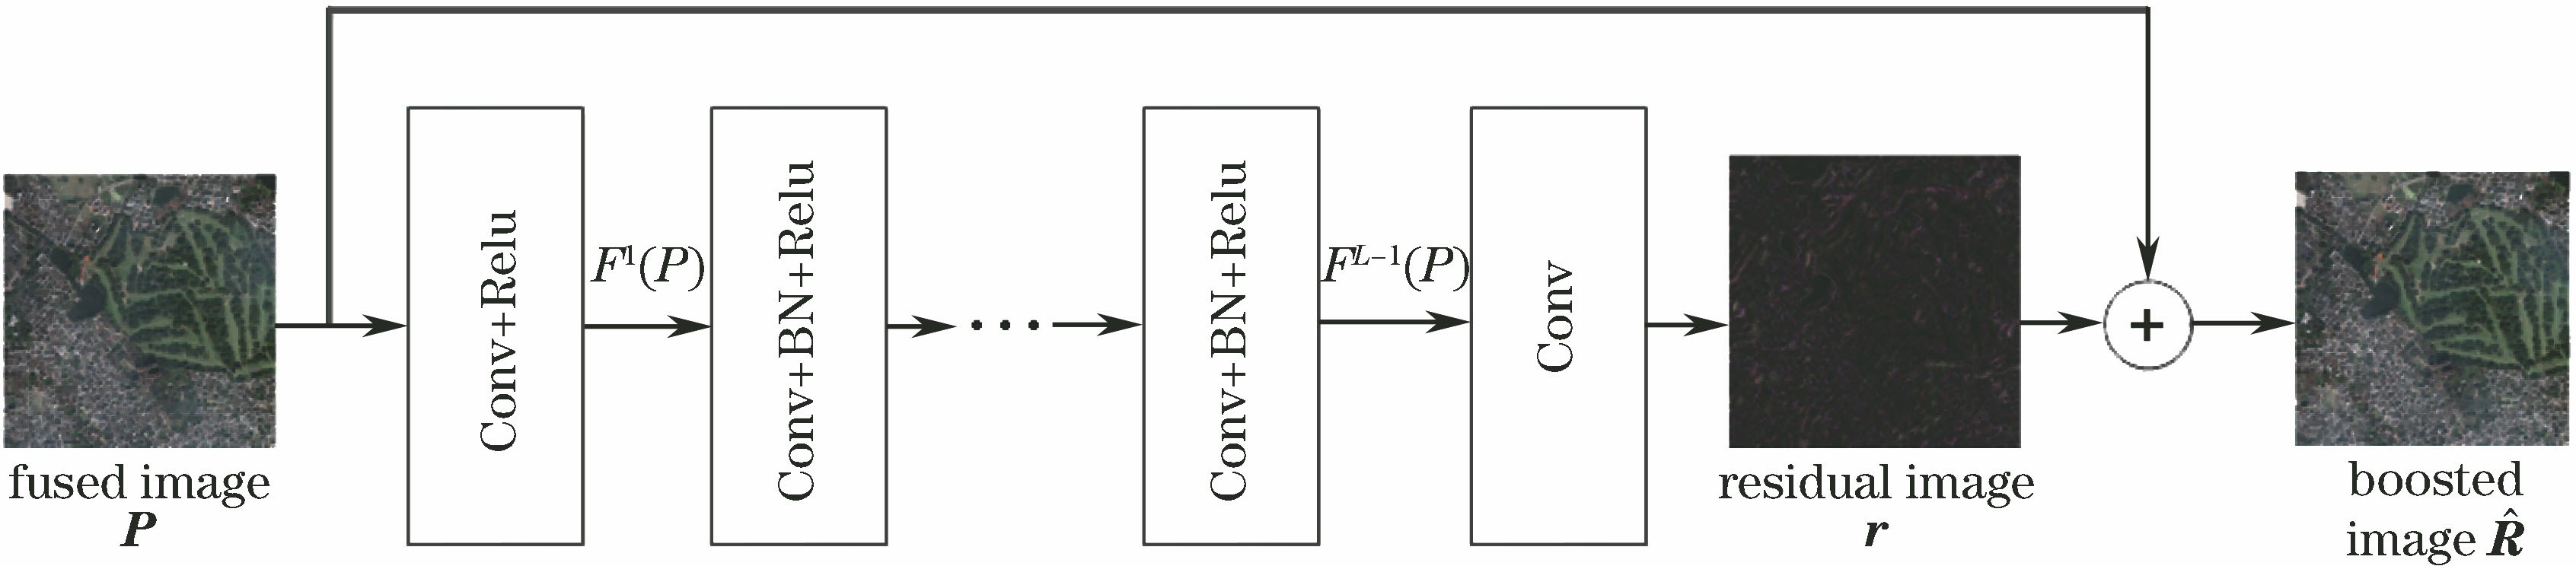
Fig. 2. Structure of boosting network
Fig. 3. Experimental images. (a) MS; (b) PAN
Fig. 4. Results of different fusion methods. (a) ATWT; (b) BT; (c) GIHS; (d) GS; (e) SVT; (f) SWT
Fig. 5. Boosted results of different fusion methods. (a) ATWT; (b) BT; (c) GIHS; (d) GS; (e) SVT; (f) SWT
Fig. 6. Influences of different network parameters on experimental results. (a) ERGAS; (b) SAM; (c) Q4; (d) CC
Fig. 7. Reference image and results of compared methods and proposed method. (a) Reference image; (b) CS; (c) DRPNN; (d) PNN; (e) proposed method
Fig. 8. Reference image and results of compared methods and proposed method. (a) Reference image; (b) CS; (c) DRPNN; (d) PNN; (e) proposed method
Fig. 9. Different reference images and results of proposed method. (a) Reference images; (b) results of proposed method
Method | ATWT | BT | GIHS | GS | SWT | SVT |
---|
Fusion | 0.0327 | 0.0542 | 0.0323 | 0.1653 | 1.1115 | 0.1728 | Boosting | 1.0147 | 0.9499 | 0.9509 | 0.9479 | 0.9540 | 0.9546 | Total | 1.0474 | 1.0042 | 0.9832 | 1.1132 | 2.0655 | 1.1274 |
|
Table 1. Running time of different methods and corresponding boosting stages
Index | ATWT | BT | GIHS |
---|
Fused result | Boosted result | Fused result | Boosted result | Fused result | Boosted result |
---|
ERGAS | 5.5413 | 3.6464 | 7.7943 | 3.5788 | 5.5766 | 3.8262 | SAM | 8.5281 | 5.7892 | 6.0326 | 5.4821 | 6.5539 | 5.7464 | Q4 | 0.7085 | 0.8444 | 0.7600 | 0.8616 | 0.7479 | 0.8590 | CC | 0.8487 | 0.9358 | 0.7822 | 0.9375 | 0.8481 | 0.9297 | Index | GS | SVT | SWT | Fused result | Boosted result | Fused result | Boosted result | Fused result | Boosted result | ERGAS | 4.7565 | 3.2772 | 4.0625 | 2.8333 | 4.5673 | 3.2977 | SAM | 5.8587 | 5.2991 | 6.1018 | 4.5629 | 6.9649 | 5.2726 | Q4 | 0.7900 | 0.8875 | 0.8035 | 0.9044 | 0.7837 | 0.8727 | CC | 0.9117 | 0.9490 | 0.9223 | 0.9614 | 0.8988 | 0.9478 |
|
Table 2. Evaluation of fusion results obtained by different methods and corresponding boosted results
Figure | Index | CS | DRPNN | PNN | Proposed method | Ideal |
---|
Fig. 7 | ERGAS | 3.1382 | 3.2030 | 2.4409 | 2.3934 | 0 | SAM | 4.5610 | 3.7884 | 3.7599 | 3.6627 | 0 | Q4 | 0.7631 | 0.7447 | 0.8032 | 0.8005 | 1 | CC | 0.9510 | 0.9532 | 0.9705 | 0.9698 | 1 | Fig. 8 | ERGAS | 2.5521 | 2.7164 | 2.2530 | 2.2412 | 0 | SAM | 3.4794 | 3.1021 | 3.3527 | 3.3413 | 0 | Q4 | 0.6290 | 0.6229 | 0.6463 | 0.6338 | 1 | CC | 0.9612 | 0.9587 | 0.9725 | 0.9676 | 1 | Fig. 9(The 1st column) | ERGAS | 3.7382 | 3.6131 | 3.0033 | 2.5599 | 0 | SAM | 5.8313 | 5.0033 | 5.0254 | 4.2870 | 0 | Q4 | 0.8693 | 0.8565 | 0.9095 | 0.9169 | 1 | CC | 0.9353 | 0.9371 | 0.9568 | 0.9684 | 1 | Fig. 9(The 2nd column) | ERGAS | 3.9656 | 4.2478 | 3.1395 | 3.0194 | 0 | SAM | 6.1953 | 5.2592 | 5.2617 | 4.9211 | 0 | Q4 | 0.8917 | 0.8562 | 0.9333 | 0.9303 | 1 | CC | 0.9285 | 0.9149 | 0.9538 | 0.9572 | 1 | Fig. 9(The 3rd column) | ERGAS | 3.7939 | 3.6033 | 2.8936 | 2.1136 | 0 | SAM | 5.8606 | 4.6764 | 4.6806 | 3.6695 | 0 | Q4 | 0.8656 | 0.8472 | 0.9142 | 0.9377 | 1 | CC | 0.9329 | 0.9350 | 0.9585 | 0.9777 | 1 |
|
Table 3. Evaluation of compared methods and proposed method