Author Affiliations
1State Key Laboratories of Transducer Technology, Shanghai Institute of Technical Physics, Chinese Academy of Sciences, Shanghai 200083, China2Shanghai Institute of Technical Physics, Chinese Academy of Sciences, Shanghai 200083, Chinashow less
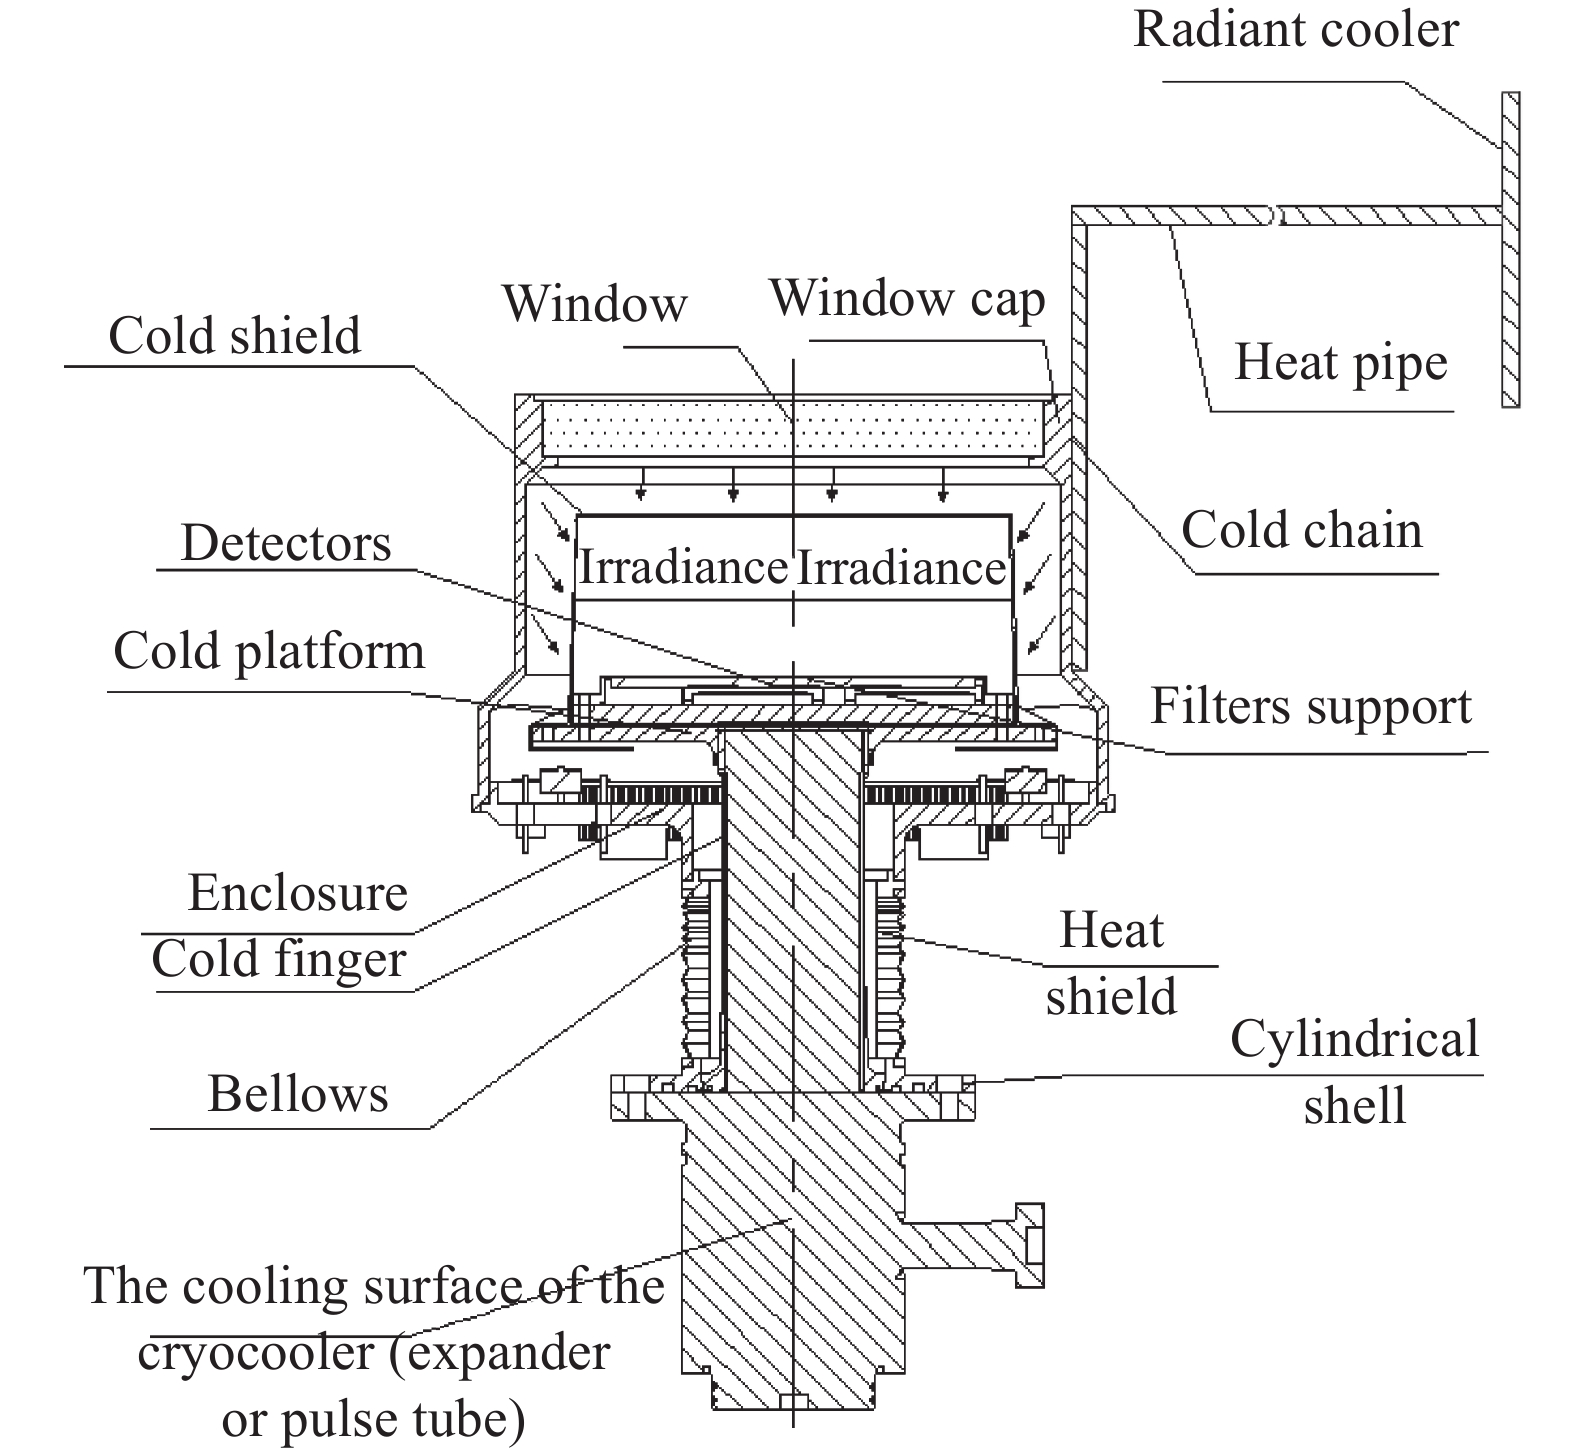
Fig. 1. Schematic diagram of Dewar structure and irradiance
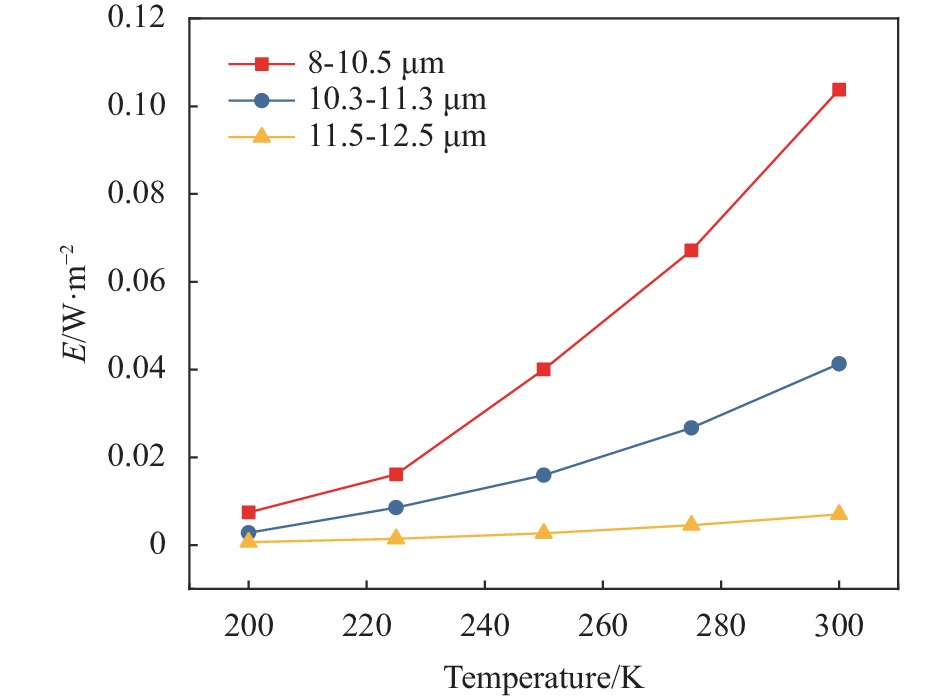
Fig. 2. Detector irradiance from stray light from the window cap at 300 K and 200 K
Fig. 3. Schematic diagram of bellows size
Fig. 4. Mechanics FEM model of test Dewar
Fig. 5. The figure of thermal network model
Fig. 6. Schematic diagram of heat leakage measurement of bellows
Fig. 7. Schematic diagram of low temperature test of integrated detector Dewar coller assembly
Fig. 8. Refrigeration Capacity of Cryocooler under Different Operating Conditions
Fig. 9. Flow chart of sinusoidal and random vibration test of integrated detector dewarcoller assembly
| Items | Design requirements (Dewar heat
load 1 W@55 K@195 K)
| | Temperature difference between vessel and window cap | ≥18 K | | Thermal resistance of bellows (77 K) | 800 K/W | | Random vibration condition
| 20-100 +3 dB/oct
100-600 0.01946 g2/Hz
600-2 000 -9 dB/oct
|
|
Table 1. Design requirements
| Items | Design parameters | | Items | Design parameters | | Wall thickness/mm | 0.1 | | Inside | Vacuum | | Material/L | 316 | Outside | Atmosphere | | Wave pitch/mm | 0.85 | Stroke/mm | 4 | | Wave number | 26 | Shaft | Ø30
| | Leak rate (He)/Torr·s−1 | <1E-10 | Setting direction | Vertical | | Size | 0.D.46×I.D.33 | Shape | V |
|
Table 2. Design parameters of bellows
| Name | Material | Density/kg·m−3 | Elastic modulus/GPa | Specific heat capacity/J·kg−1·K−1 | | Cylindrical shell | 304 L | 8050 | 200 | 409 | | Bellows | 316 L | 8050 | 200 | 409 | | Enclosure | Kavar | 8360 | 142 | 352 |
|
Table 3. Materials and properties of each part of the model
| Mode | Frequency/Hz | | 1 | 450.5 | | 2 | 469.13 | | 3 | 562.14 | | 4 | 1381.4 | | 5 | 1398.8 |
|
Table 4. Result of modal analysis
| Cryocooler working condition | Temperature of detector/K | Solid heat leakage/mW | Radiant heat leakage/mW | Thermal loads of Dewar/mW | | Normal temperature condition
(pulse tube @23 °C)
| 60 | 673 | 1000 | 1673 | | High temperature conditions
(pulse 263 K, window cap 228 K)
| 60 | 456 | 306 | 762 | | 55 | 471 | 305 | 776 | | Low temperature conditions
(pulse 228 K, window cap 193 K)
| 60 | 375 | 169 | 544 | | 55 | 387 | 170 | 557 | | 50 | 404 | 171 | 575 |
|
Table 5. Thermal loads of Dewar
| Q/W
| T1/K
| T2/K
| ∆T/K
| Thermal resistance/K·W−1 | Theoretical thermal resistance/K·W−1 | Deviation | | 0 | 74.45 | 153.5 | 79.05 | | | | | 0.101 | 77.6 | 193 | 115.4 | 1142.574 | 1 831 | 37% |
|
Table 6. Determination of thermal resistance of bellows
| Cryocooler working
condition
| Temperature of
detector/K
| Dewar leakage heat/mW | Detector power
consumption
/mW
| Total load/mW | Temperature of
window cap/K
| Temperature
of Hot end
bellows/K
| Temperature of Cold end
bellows/K
| Cooler power
consumption/Wac
| Insulation effect
of bellows/K
| | Normal temperature condition
(Pulse tube @296 K)
| 60 | 1673 | 0 | 1673 | 296 | 296 | 296 | 99 | | | High temperature conditions
(pulse 263 K,
window cap 228 K)
| 60 | 762 | 0 | 762 | 229.84 | 267.71 | 230.49 | 52.08 | 37.22 | | 60 | 762 | 600 | 1362 | 225.5 | 265.81 | 226.7 | 69.06 | 39.11 | | 55 | 776 | 600 | 1376 | 223.21 | 263.94 | 224.35 | 89.1 | 39.59 | | 55 | 776 | 0 | 776 | 221.88 | 263.4 | 222.47 | 61.6 | 40.93 | | Low temperature conditions
(pulse 228 K,
window cap 193 K)
| 60 | 544 | 0 | 544 | 214.56 | 253.16 | 215.52 | 46.84 | 37.64 | | 60 | 544 | 600 | 1144 | 194.08 | 241.87 | 195.7 | 60.77 | 46.17 | | 55 | 557 | 600 | 1157 | 193.27 | 243.52 | 194.61 | 72.74 | 48.91 | | 55 | 557 | 0 | 557 | 192.83 | 242.31 | 194.25 | 56.52 | 48.06 | | 50 | 575 | 0 | 575 | 192.43 | 241.04 | 194.41 | 65.72 | 46.63 | | 50 | 575 | 600 | 1175 | 192.1 | 241.48 | 193.2 | 94.94 | 48.28 |
|
Table 7. Low temperature test data of integrated detector dewarcoller assembly
| Refrigerator working condition | Temperature of detector/K | Before mechanical test | After mechanical test | | Cooler power consumption/Wac | Insulation effect of bellows/K | Cooler power consumption/Wac | Insulation effect of bellows/K | | High temperature conditions (pulse 263 K, window cap 228 K) | 60 | 52.08 | 37.22 | 52.11 | 37.33 | | 60 | 69.06 | 39.11 | 69.61 | 39.42 | | 55 | 89.1 | 39.59 | 88.92 | 39.83 | | 55 | 61.6 | 40.93 | 61.48 | 41.09 | | Low temperature conditions (pulse 228 K, window cap 193 K) | 60 | 46.84 | 37.64 | 47.07 | 37.87 | | 60 | 60.77 | 46.17 | 60.59 | 46.49 | | 55 | 72.74 | 48.91 | 72.66 | 49.15 | | 55 | 56.52 | 48.06 | 56.80 | 48.01 | | 50 | 65.72 | 46.63 | 65.59 | 47.10 | | 50 | 94.94 | 48.28 | 94.66 | 48.57 |
|
Table 8. Comparison of data before and after mechanical test