
Yang Hu, Ji Li, Xuezhi Jia. Optimal Design of Lightweight Off-Axis Mirror and Flexible Support[J]. Acta Optica Sinica, 2020, 40(19): 1923002
- Acta Optica Sinica
- Vol. 40, Issue 19, 1923002 (2020)
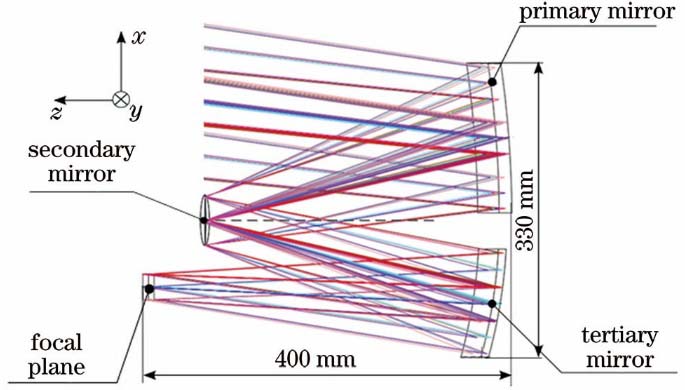
Fig. 1. Schematic of optical system
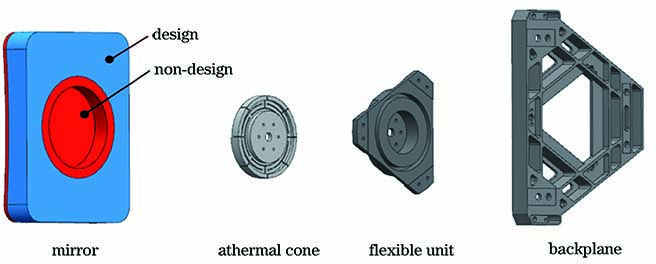
Fig. 2. Component structures of original mirror
Fig. 3. Surface shape solving process based on DRESP2
Fig. 4. Iterative convergence curve and optimization result. (a) Iterative convergence curve; (b) SIMP topology optimization result
Fig. 5. Structural parameters of mirror assembly. (a) Vertical view of mirror; (b) section view of mirror; (c) vertical view of athermal cone
Fig. 6. Flow chart of integrated optimization platform processing
Fig. 7. Iterative curves after optimization in different situations. (a) RMS values of surface shape at +4 ℃; (b) RMS values of gravity surface in x direction; (c) mass of reflector component; (d) eccentricity of x-gravity condition; (e) eccentricity of y-gravity condition; (f) eccentricity of z-gravity condition; (g) x-tilt of gravity condition; (h) y-tilt of gravity condition
Fig. 8. Surface shape analysis results under different conditions. (a) x-gravity condition; (b) 4 ℃ temperature rise
Fig. 9. Camera mechanical vibration test platform
Fig. 10. Sine frequency sweep test data. (a) x-direction sine sweep; (b) y-direction sine sweep; (c) z-direction sine sweep
Fig. 11. Surface interference detection site
Fig. 12. Test results of mirror before and after test. (a) Before test; (b) after test
|
Table 1. Performance indicators of common space camera materials
|
Table 2. Optimal parameter combination results
| ||||||||||||||||||||||||||||||||
Table 3. Optimize analysis results
|
Table 4. Frequency comparison in different situations

Set citation alerts for the article
Please enter your email address
© Copyright 2018-2021 | Chinese Laser Press. All Rights Reserved 沪ICP备15018463号-20