
Wan LI, Haitao LONG, Weibing XU, Huali XUE, Wenqiang CAO, Zhaodi LI, Lumei PU. Effects of contact glow discharge plasma on Lycium barbarum seed germination and seed treatment methodology[J]. Journal of Radiation Research and Radiation Processing, 2023, 41(1): 010401
Journals >Journal of Radiation Research and Radiation Processing >Volume 41 >Issue 1 >Page 010401 > Article
- Journal of Radiation Research and Radiation Processing
- Vol. 41, Issue 1, 010401 (2023)
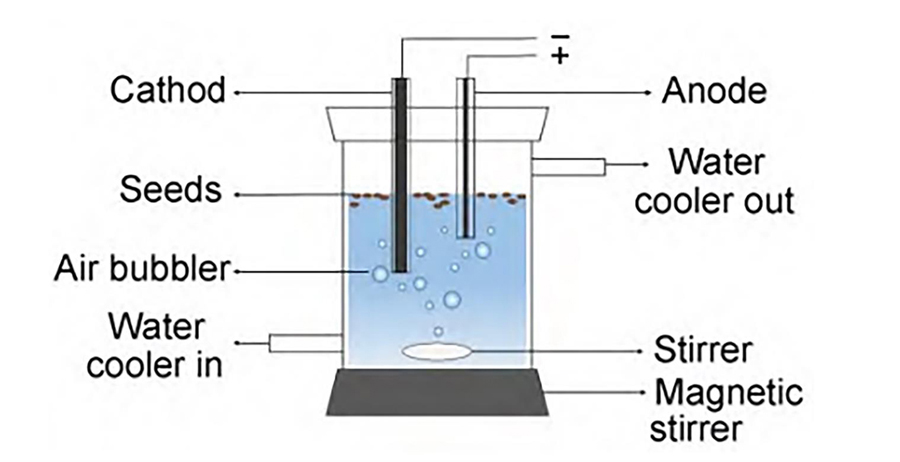
Fig. 1. Schematic diagram of experimental equipment
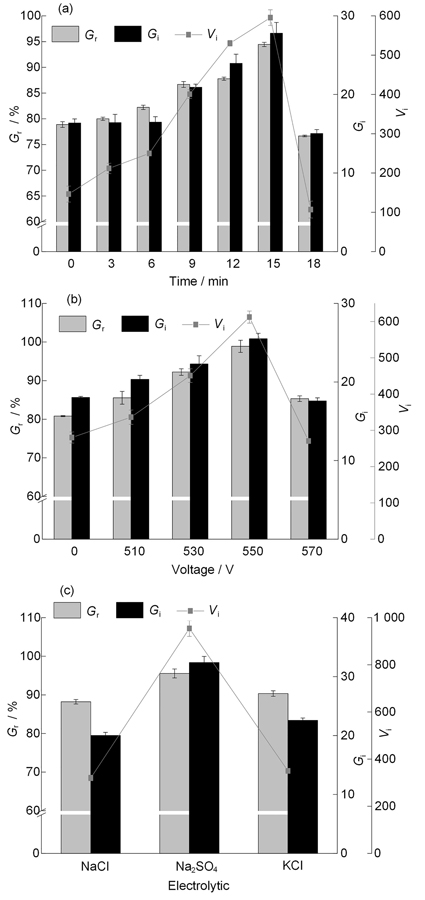
Fig. 2. Effects of single factor on germination index of Lycium barbarum: (a) time; (b) voltage; (c) electrolytic
Fig. 3. Contour and response surface diagram of the interaction of various factors on germination rate
Fig. 4. Contour and response surface diagram of the interaction of various factors on the vigor index
Fig. 5. Seed germination parameters for verification test
Fig. 6. Contact angle measurement images before and after treatment with CGDP: (a) control; (b) treatment; CA stands for contact angle
Fig. 7. Effects of CGDP treatment on seed surface contact angle
Fig. 8. Effects of contact glow discharge plasma treatment on seed coat morphology: (a) and (b) are SEM images for the untreated Lycium barbarum seed surface at magnifications of 1 000 × and 3 000 ×, respectively; (c) and (d) are corresponding images after 15 min plasma treatment
Fig. 9. Seedlings growth after transplanting for 30 d before (a, b, c) and after (d, e, f) CGDP treatment
Fig. 10. Effects of CGDP on chlorophyll content in Lycium barbarum leaves
Fig. 11. Schematic diagram of the effects of CGDP on seed germination and growth
|
Table 1. Factors and level of Box-Behnken experiment
|
Table 2. Box-Behnken design and results
|
Table 3. Analysis of variance of regression model

Set citation alerts for the article
Please enter your email address
© Copyright 2018-2021 | Chinese Laser Press. All Rights Reserved 沪ICP备15018463号-20