
Ruidong Xie, Jinwei Zhu, Qi Zhong, Feng Gao. Temperature Prediction Based on Neural Network for Selective Laser Sintering[J]. Laser & Optoelectronics Progress, 2022, 59(19): 1916005
- Laser & Optoelectronics Progress
- Vol. 59, Issue 19, 1916005 (2022)
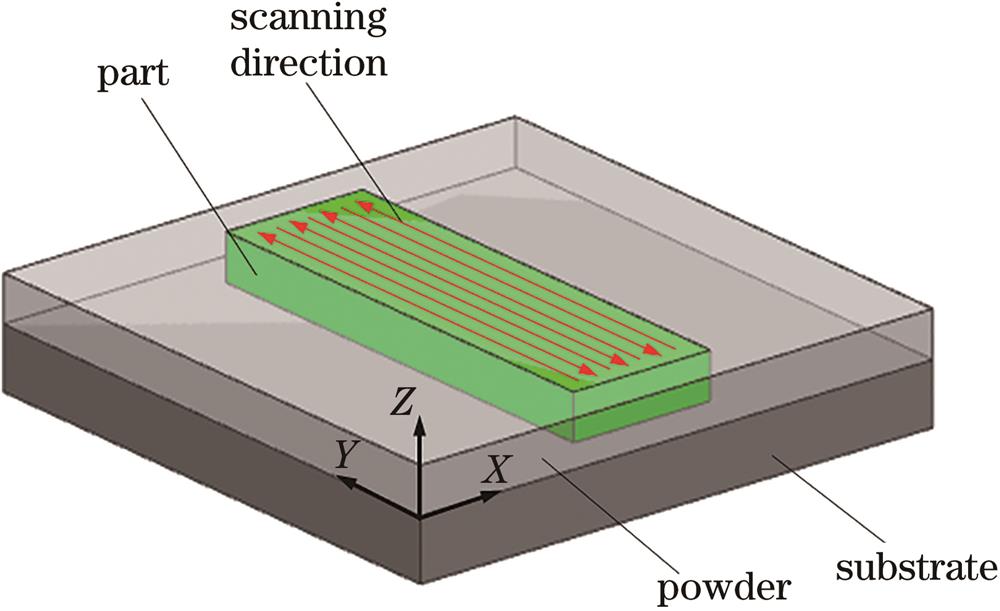
Fig. 1. Schematic diagram of the SLS process of the multitrack-multilayer part
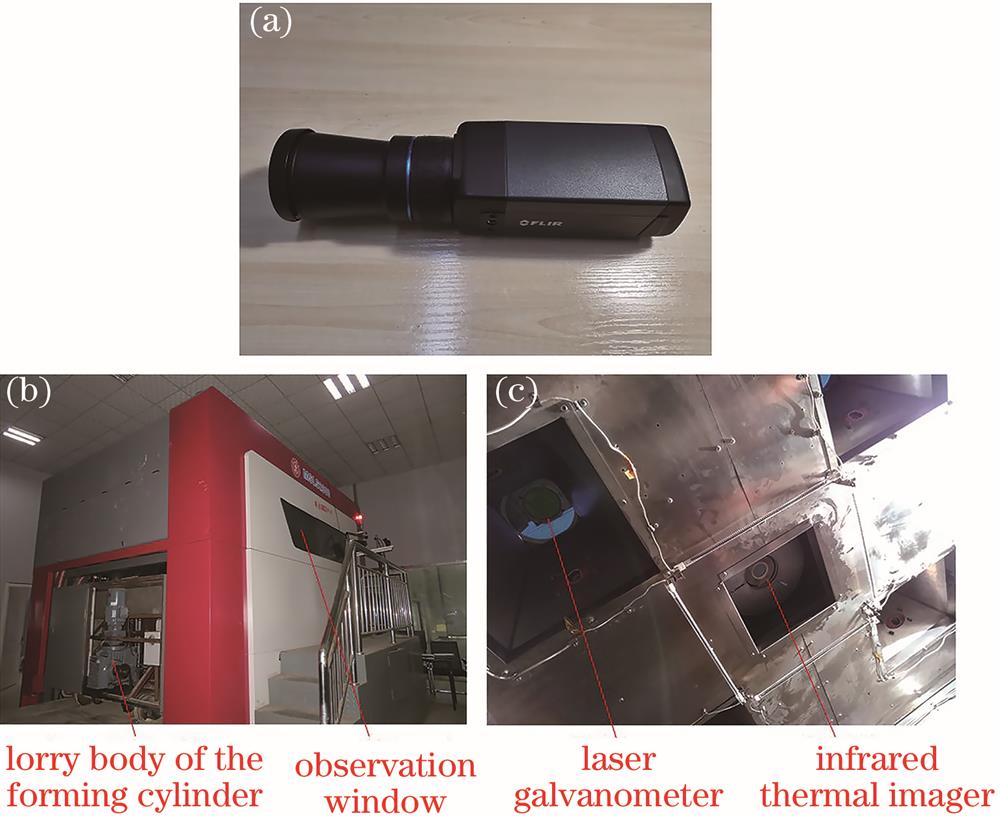
Fig. 2. 4-beams SLS forming system and the infrared thermal imager. (a) FLIR A615 infrared thermal imager; (b) SLS forming system; (c) ceiling of the forming cabin
Fig. 3. SLS temperature field simulation image with the process parameters of the group 10
Fig. 4. Detected images of sintering points temperatures with the process parameters of the group 10
Fig. 5. SLS temperature field simulation image with the process parameters of the group 18
Fig. 6. Detected images of sintering points temperatures with the process parameters of the group 18
Fig. 7. Schematic diagram of sintering points temperatures prediction model based on neural network
Fig. 8. Algorithm flow of BP neural network optimized by GA
Fig. 9. Testing sample errors of the GA-BP neural network
Fig. 10. Interface of sintering points temperatures prediction software
Fig. 11. Design model of the thin cuboid
Fig. 12. Comparison of predicted and detected sintering points temperatures of part 1. (a) Predicted temperatures; (b) detected temperatures
Fig. 13. Comparison of predicted and detected sintering points temperatures of part 2. (a) Predicted temperatures; (b) detected temperatures
|
Table 1. Process parameters of the simulation experiments
|
Table 2. Technical parameters of the FLIR A615 infrared thermal imager

Set citation alerts for the article
Please enter your email address
© Copyright 2018-2021 | Chinese Laser Press. All Rights Reserved 沪ICP备15018463号-20