• Laser & Optoelectronics Progress
  • Vol. 59, Issue 10, 1030001 (2022)
Minglei Yang1、2 and Yuzhu Liu1、2、*
Author Affiliations
  • 1Jiangsu Key Laboratory of Optoelectronic Detection of Atmosphere and Ocean, Nanjing University of Information Science & Technology, Nanjing 210044, Jiangsu , China
  • 2Jiangsu Collaborative Innovation Center of Atmospheric Environment and Equipment Technology, Nanjing 210044, Jiangsu , China
  • show less
    DOI: 10.3788/LOP202259.1030001 Cite this Article Set citation alerts
    Minglei Yang, Yuzhu Liu. Element Detection in Porphyra Yezoensis via Laser-Induced Breakdown Spectroscopy[J]. Laser & Optoelectronics Progress, 2022, 59(10): 1030001 Copy Citation Text show less
    Schematic of the experimental setup
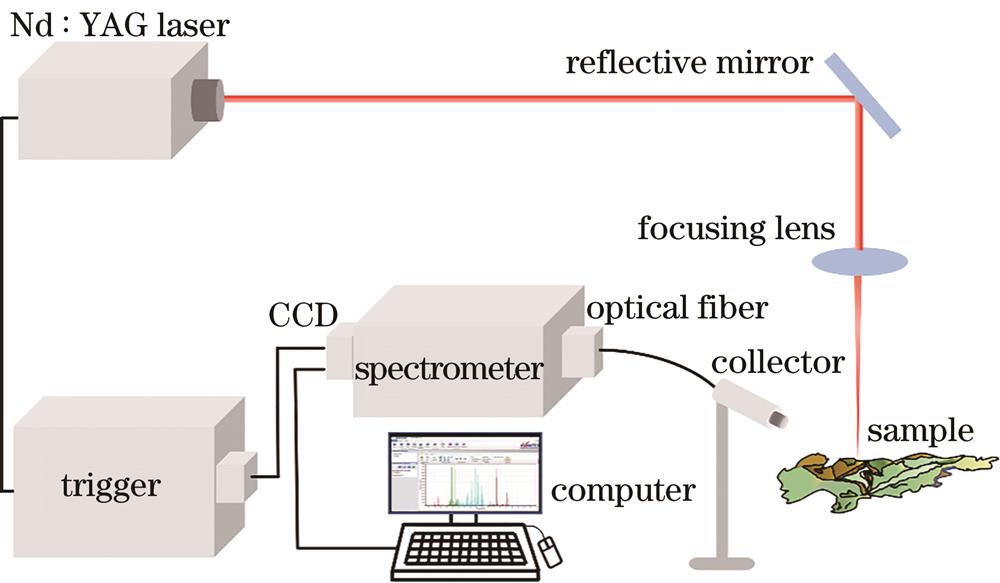
    Fig. 1. Schematic of the experimental setup
    Spectra of porphyra yezoensis. (a) channel from 210 nm to 270 nm; (b) channel from 270 nm to 320 nm; (c) channel from 360 nm to 460 nm; (d) channel from 510 nm to 650 nm; (e) channel from 710 nm to 880 nm
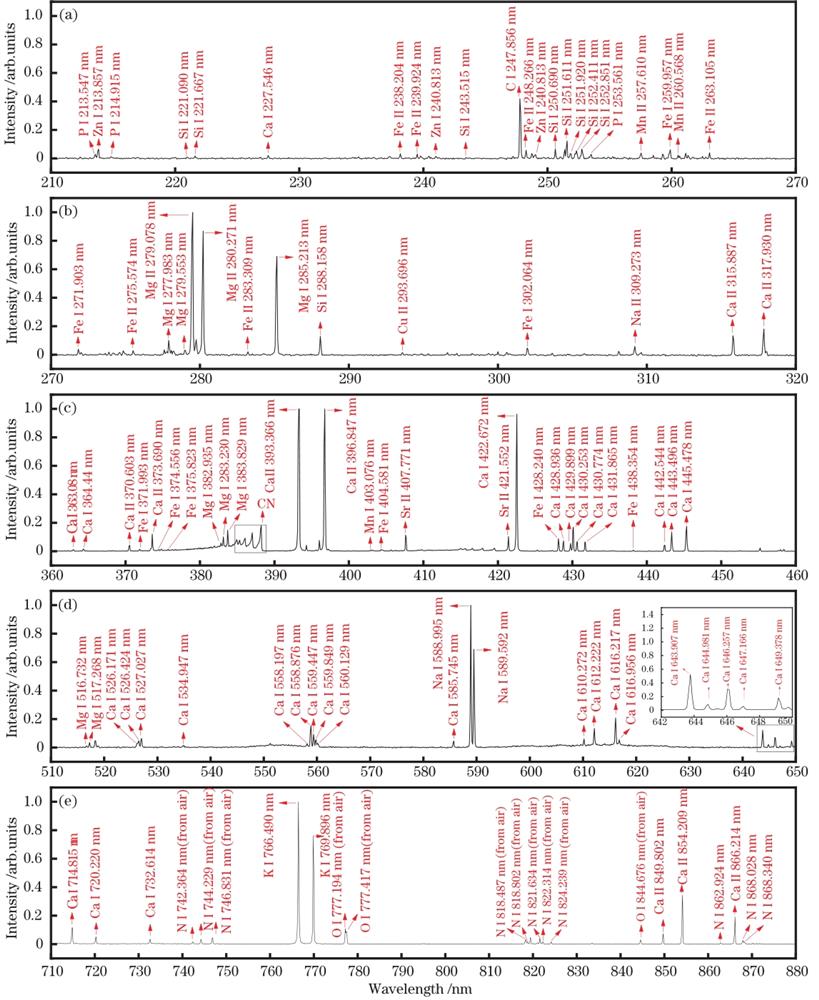
    Fig. 2. Spectra of porphyra yezoensis. (a) channel from 210 nm to 270 nm; (b) channel from 270 nm to 320 nm; (c) channel from 360 nm to 460 nm; (d) channel from 510 nm to 650 nm; (e) channel from 710 nm to 880 nm
    Spectral contrast of unsoaked and soaked porphyra yezoensis in Pb solution. (a) Spectrum of unsoaked porphyra yezoensis; (b) spectrum of soaked porphyra yezoensis
    Fig. 3. Spectral contrast of unsoaked and soaked porphyra yezoensis in Pb solution. (a) Spectrum of unsoaked porphyra yezoensis; (b) spectrum of soaked porphyra yezoensis
    Spectra of porphyra yezoensis soaked in lead with different concentrations
    Fig. 4. Spectra of porphyra yezoensis soaked in lead with different concentrations
    Calibration curve for Pb in porphyra yezoensis sample
    Fig. 5. Calibration curve for Pb in porphyra yezoensis sample
    Comparison between theoretical spectral intensity and actual spectral initensity
    Fig. 6. Comparison between theoretical spectral intensity and actual spectral initensity
    Saha-Boltzman plot of Pb spectral lines
    Fig. 7. Saha-Boltzman plot of Pb spectral lines
    Lorentz curve fitting for Stark widening of Pb(405.781 nm)
    Fig. 8. Lorentz curve fitting for Stark widening of Pb(405.781 nm)
    Results of simulation and experiment about CN molecule in the porphyra yezoensis
    Fig. 9. Results of simulation and experiment about CN molecule in the porphyra yezoensis
    SamplelnIijλ/Aijgk
    368.227 nm363.897 nm373.926 nm367.149 nm357.180 nm
    Average relative error /%0.550.751.481.872.04
    Sample 1-34.530-34.738-36.458-36.230-36.941
    Sample 2-34.600-34.822-37.320-37.723-37.855
    Sample 3-34.667-34.706-37.196-37.471-37.773
    Sample 4-34.953-35.084-37.440-37.958-38.005
    Sample 5-34.497-34.649-36.545-36.555-37.016
    Sample 6-34.600-34.602-36.825-37.244-37.344
    Sample 7-34.673-34.824-37.674-37.541-37.995
    Sample 8-35.202-35.386-37.612-38.702-38.123
    Sample 9-34.515-34.733-36.686-36.837-37.198
    Sample 10-34.643-34.872-37.321-37.229-37.577
    Sample 11-34.595-34.698-36.944-37.132-37.402
    Sample 12-35.255-35.372-38.150-37.699-39.067
    Theoretical value-34.562-34.616-36.715-36.813-36.936
    Table 1. Relative error analysis table of Saha-Boltzman equation
    X2+V''Level population
    V''=00.326546
    V''=10.220711
    V''=20.150286
    V''=30.103136
    V''=40.071369
    V''=50.049824
    V''=60.035112
    V''=70.025039
    V''=80.017976
    Table 2. CN molecule vibrational level populations in X2+V'' state
    Minglei Yang, Yuzhu Liu. Element Detection in Porphyra Yezoensis via Laser-Induced Breakdown Spectroscopy[J]. Laser & Optoelectronics Progress, 2022, 59(10): 1030001
    Download Citation