• Spectroscopy and Spectral Analysis
  • Vol. 41, Issue 12, 3671 (2021)
Ai-yang LI1、* and Liang FU2、2; *;
Author Affiliations
  • 11. College of Material and Chemical Engineering, Hunan Institute of Technology, Hengyang 421002, China
  • 22. College of Materials Science and Engineering, Chongqing University, Chongqing 400045, China
  • show less
    DOI: 10.3964/j.issn.1000-0593(2021)12-3671-05 Cite this Article
    Ai-yang LI, Liang FU. Study on the Analysis Total As in Bentonite With Microwave Plasma Atomic Emission Spectrometry[J]. Spectroscopy and Spectral Analysis, 2021, 41(12): 3671 Copy Citation Text show less
    Multimode sample introduction system (MSIS) setup for hydride generation
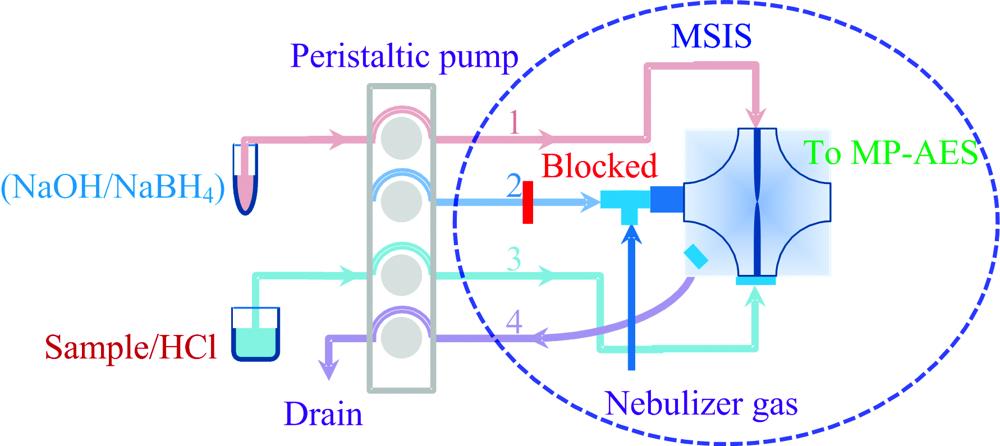
    Fig. 1. Multimode sample introduction system (MSIS) setup for hydride generation
    Emission spectra of As with different concentrations at 188.979 nm
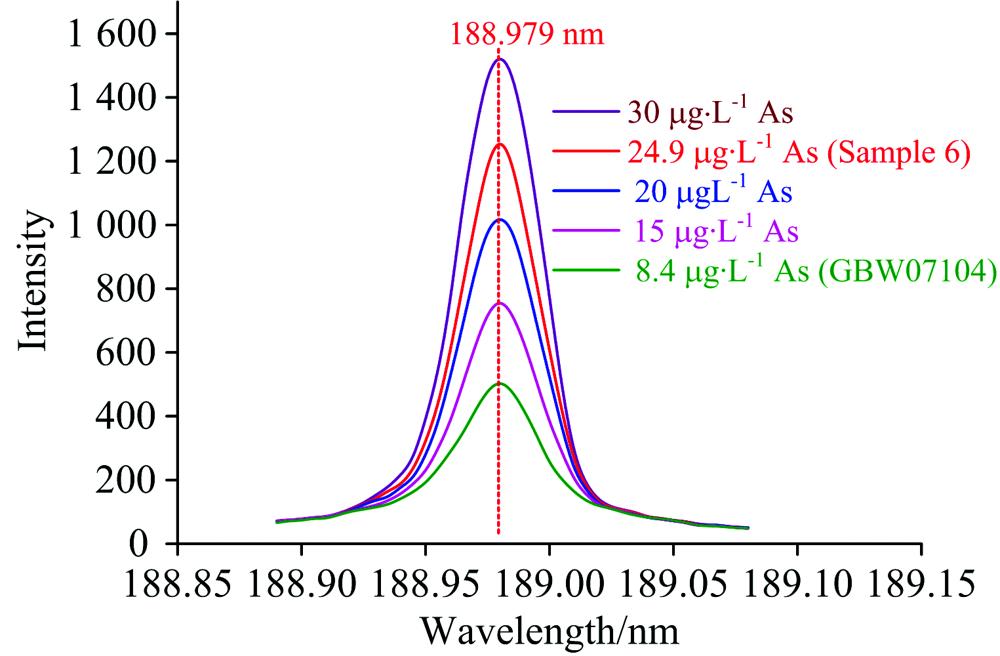
    Fig. 2. Emission spectra of As with different concentrations at 188.979 nm
    Effect of viewing position (a) and nebulizer gas flow (b) on signal intensity of As
    Fig. 3. Effect of viewing position (a) and nebulizer gas flow (b) on signal intensity of As
    The fast linear interference correction (FLIC) model of As (188.979 nm)
    Fig. 4. The fast linear interference correction (FLIC) model of As (188.979 nm)
    WavelengthViewing
    position
    Nebulizer gas flow
    /(L·min-1)
    Spectral interferencesSensitivity
    /(L·μg-1)
    As: 193.695 nm100.45Fe: 193.663 nm62.5
    As: 234.984 nm100.45Fe: 234.830 nm, Co: 234.737 nm; Be: 234.861 nm58.2
    As: 188.979 nm100.45Interference-free46.9
    Table 1. Optimization of MP-AES working condition
    SampleCertifiedDetermined
    Mean/
    (μg·g-1)
    SD/
    (μg·g-1)
    RSD/%Mean/
    (μg·g-1)
    SD/
    (μg·g-1)
    RSD/%
    GBW071042.100.5023.82.330.052.14
    GBW071071.400.4028.61.640.031.83
    GBW071096.270.457.186.510.152.30
    GBW071105.960.8914.95.720.162.80
    Table 2. Results obtained for analytes in standard reference materials using MP-AES (μg·g-1, n=6)
    Sample IDMP-AESGB methodSample IDMP-AESGB methodSample IDMP-AESGB method
    15.08±0.165.15±0.1059.05±0.409.16±0.45910.4±0.3710.2±0.41
    29.72±0.309.84±0.3566.23±0.276.38±0.20108.76±0.288.55±0.30
    36.51±0.196.40±0.2273.51±0.123.62±0.09115.39±0.165.32±0.18
    412.6±0.4513.1±0.3784.83±0.154.69±0.43127.36±0.237.45±0.45
    Table 3. Analysis results of As content in bentonite samples (mg·kg-1, n=6)
    Ai-yang LI, Liang FU. Study on the Analysis Total As in Bentonite With Microwave Plasma Atomic Emission Spectrometry[J]. Spectroscopy and Spectral Analysis, 2021, 41(12): 3671
    Download Citation