- Spectroscopy and Spectral Analysis
- Vol. 42, Issue 1, 152 (2022)
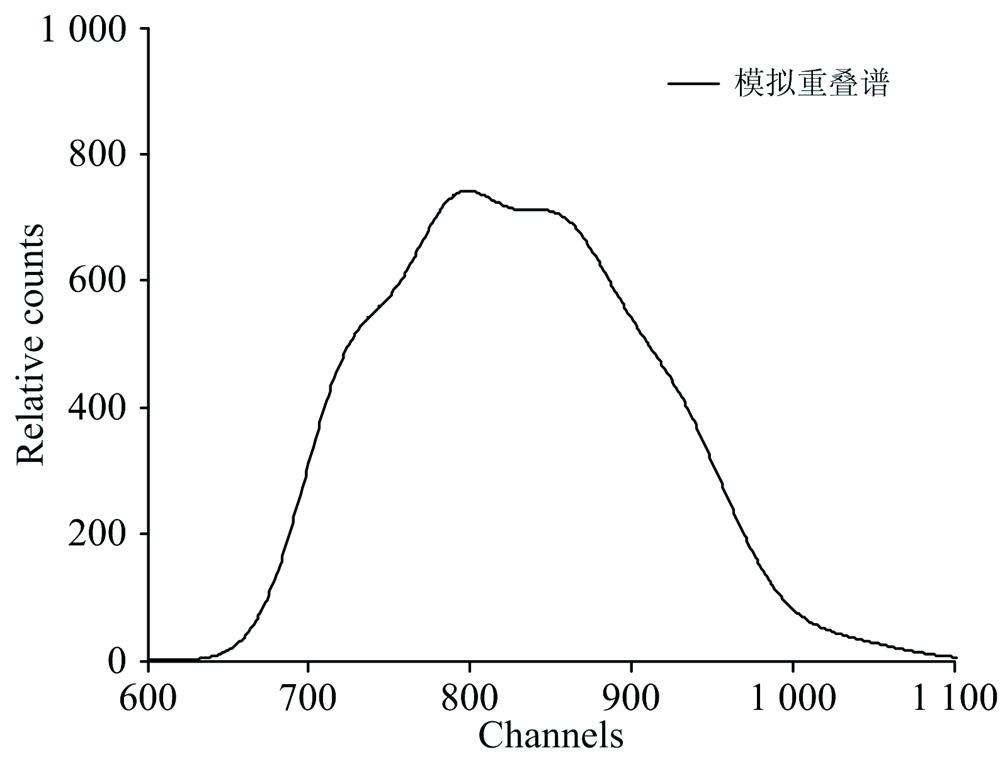
Fig. 1. Simulated overlapping spectra of Mn, Fe, Co and Ni
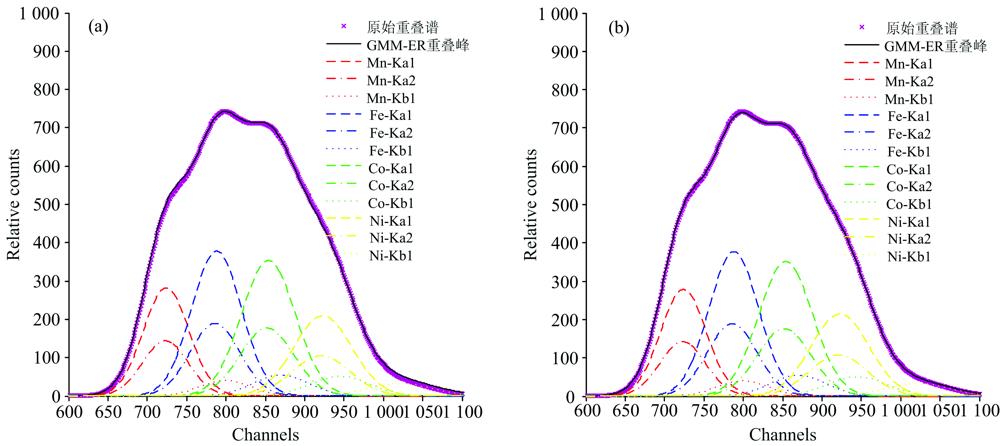
Fig. 2. Original overlapping spectrum, GMM-ER overlapping peak and decomposition peak
(a): Traditional quantum genetic algorithm; (b): Improved quantum genetic algorithm
(a): Traditional quantum genetic algorithm; (b): Improved quantum genetic algorithm
Fig. 3. The process of searching global optimal GMM-ER
(a): Traditional quantum genetic algorithm; (b): Improved quantum genetic algorithm
(a): Traditional quantum genetic algorithm; (b): Improved quantum genetic algorithm
| |||||||||||||||||||||||||||||||||||
Table 1. Main K-series characteristic X-rays of Mn, Fe, Co and Ni
|
Table 2. u (i , j ) and σ (i , j ) values of Mn, Fe, Co and Ni
|
Table 3. Optimal fitness values of overlapping spectral decomposition
| ||||||||||||||||||||||||||||||||||||||||||||||||||||
Table 4. Intensity of characteristic X-ray before and after decomposition

Download Citation

Set citation alerts for the article
Please enter your email address
© Copyright 2018-2021 | Chinese Laser Press. All Rights Reserved 沪ICP备15018463号-20