• Infrared and Laser Engineering
  • Vol. 50, Issue 9, 20210485 (2021)
Liyan Li1, Songtao Fan1, and Yan Zhou1、2、3
Author Affiliations
  • 1Optoelectronic System Laboratory, Institute of Semiconductors, Chinese Academy of Sciences, Beijing 100083, China
  • 2College of Materials Science and Opto-electronics Technology,University of Chinese Academy of Sciences, Beijing 100049, China
  • 3School of Electronic, Electrical and Communication Engineering, University of Chinese Academy of Sciences, Beijing 100049, China
  • show less
    DOI: 10.3788/IRLA20210485 Cite this Article
    Liyan Li, Songtao Fan, Yan Zhou. Eliminating light intensity disturbance algorithm based on phase demodulation carrier[J]. Infrared and Laser Engineering, 2021, 50(9): 20210485 Copy Citation Text show less
    Schematic of the new demodulation algorithm
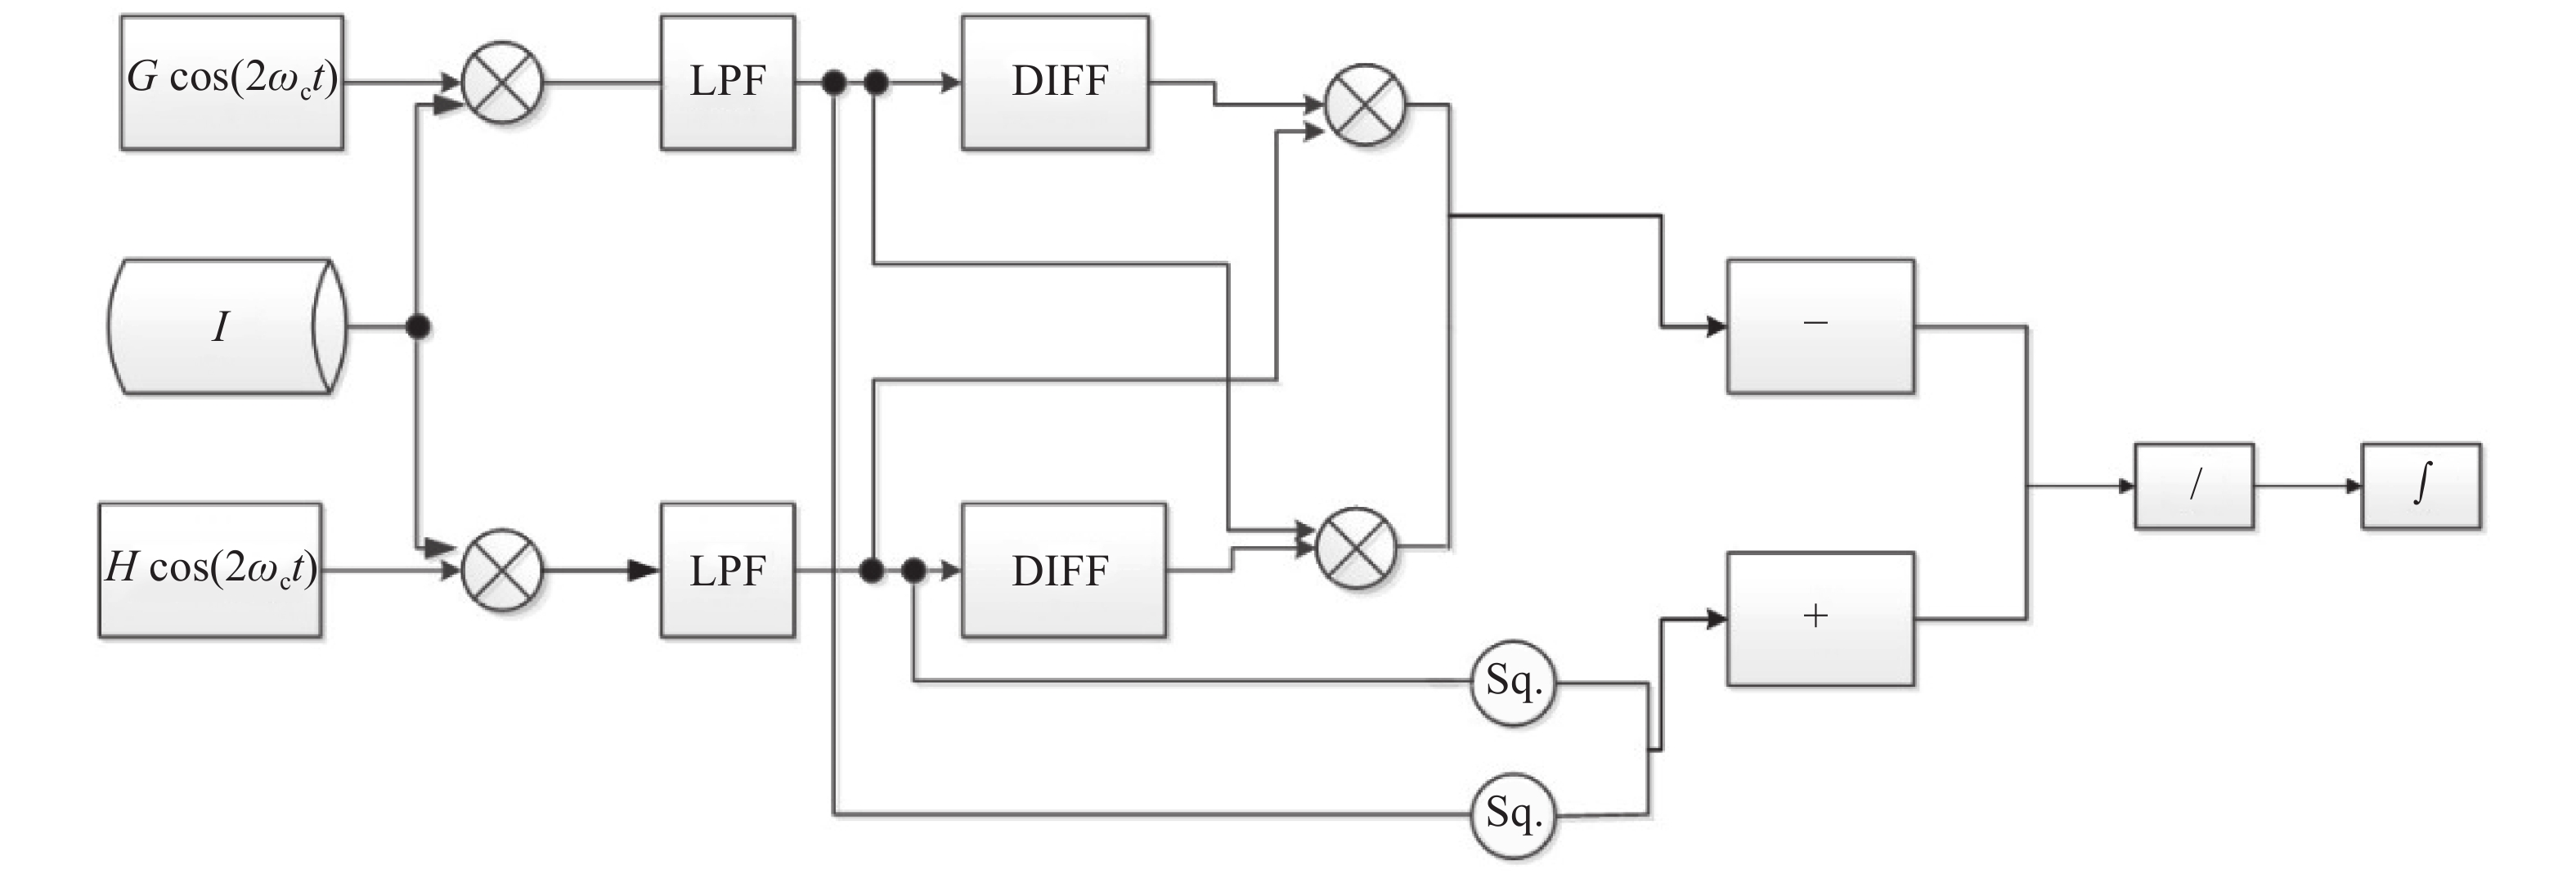
    Fig. 1. Schematic of the new demodulation algorithm
    Single frequency signal simulation of different frequencies. (a) The frequency is 500 Hz; (b) The frequency is 1 000 Hz; (c) The frequency is 1 500 Hz; (d) The frequency is 2 000 Hz; (e) The frequency is 2 500 Hz; (f) The frequency is 3 000 Hz
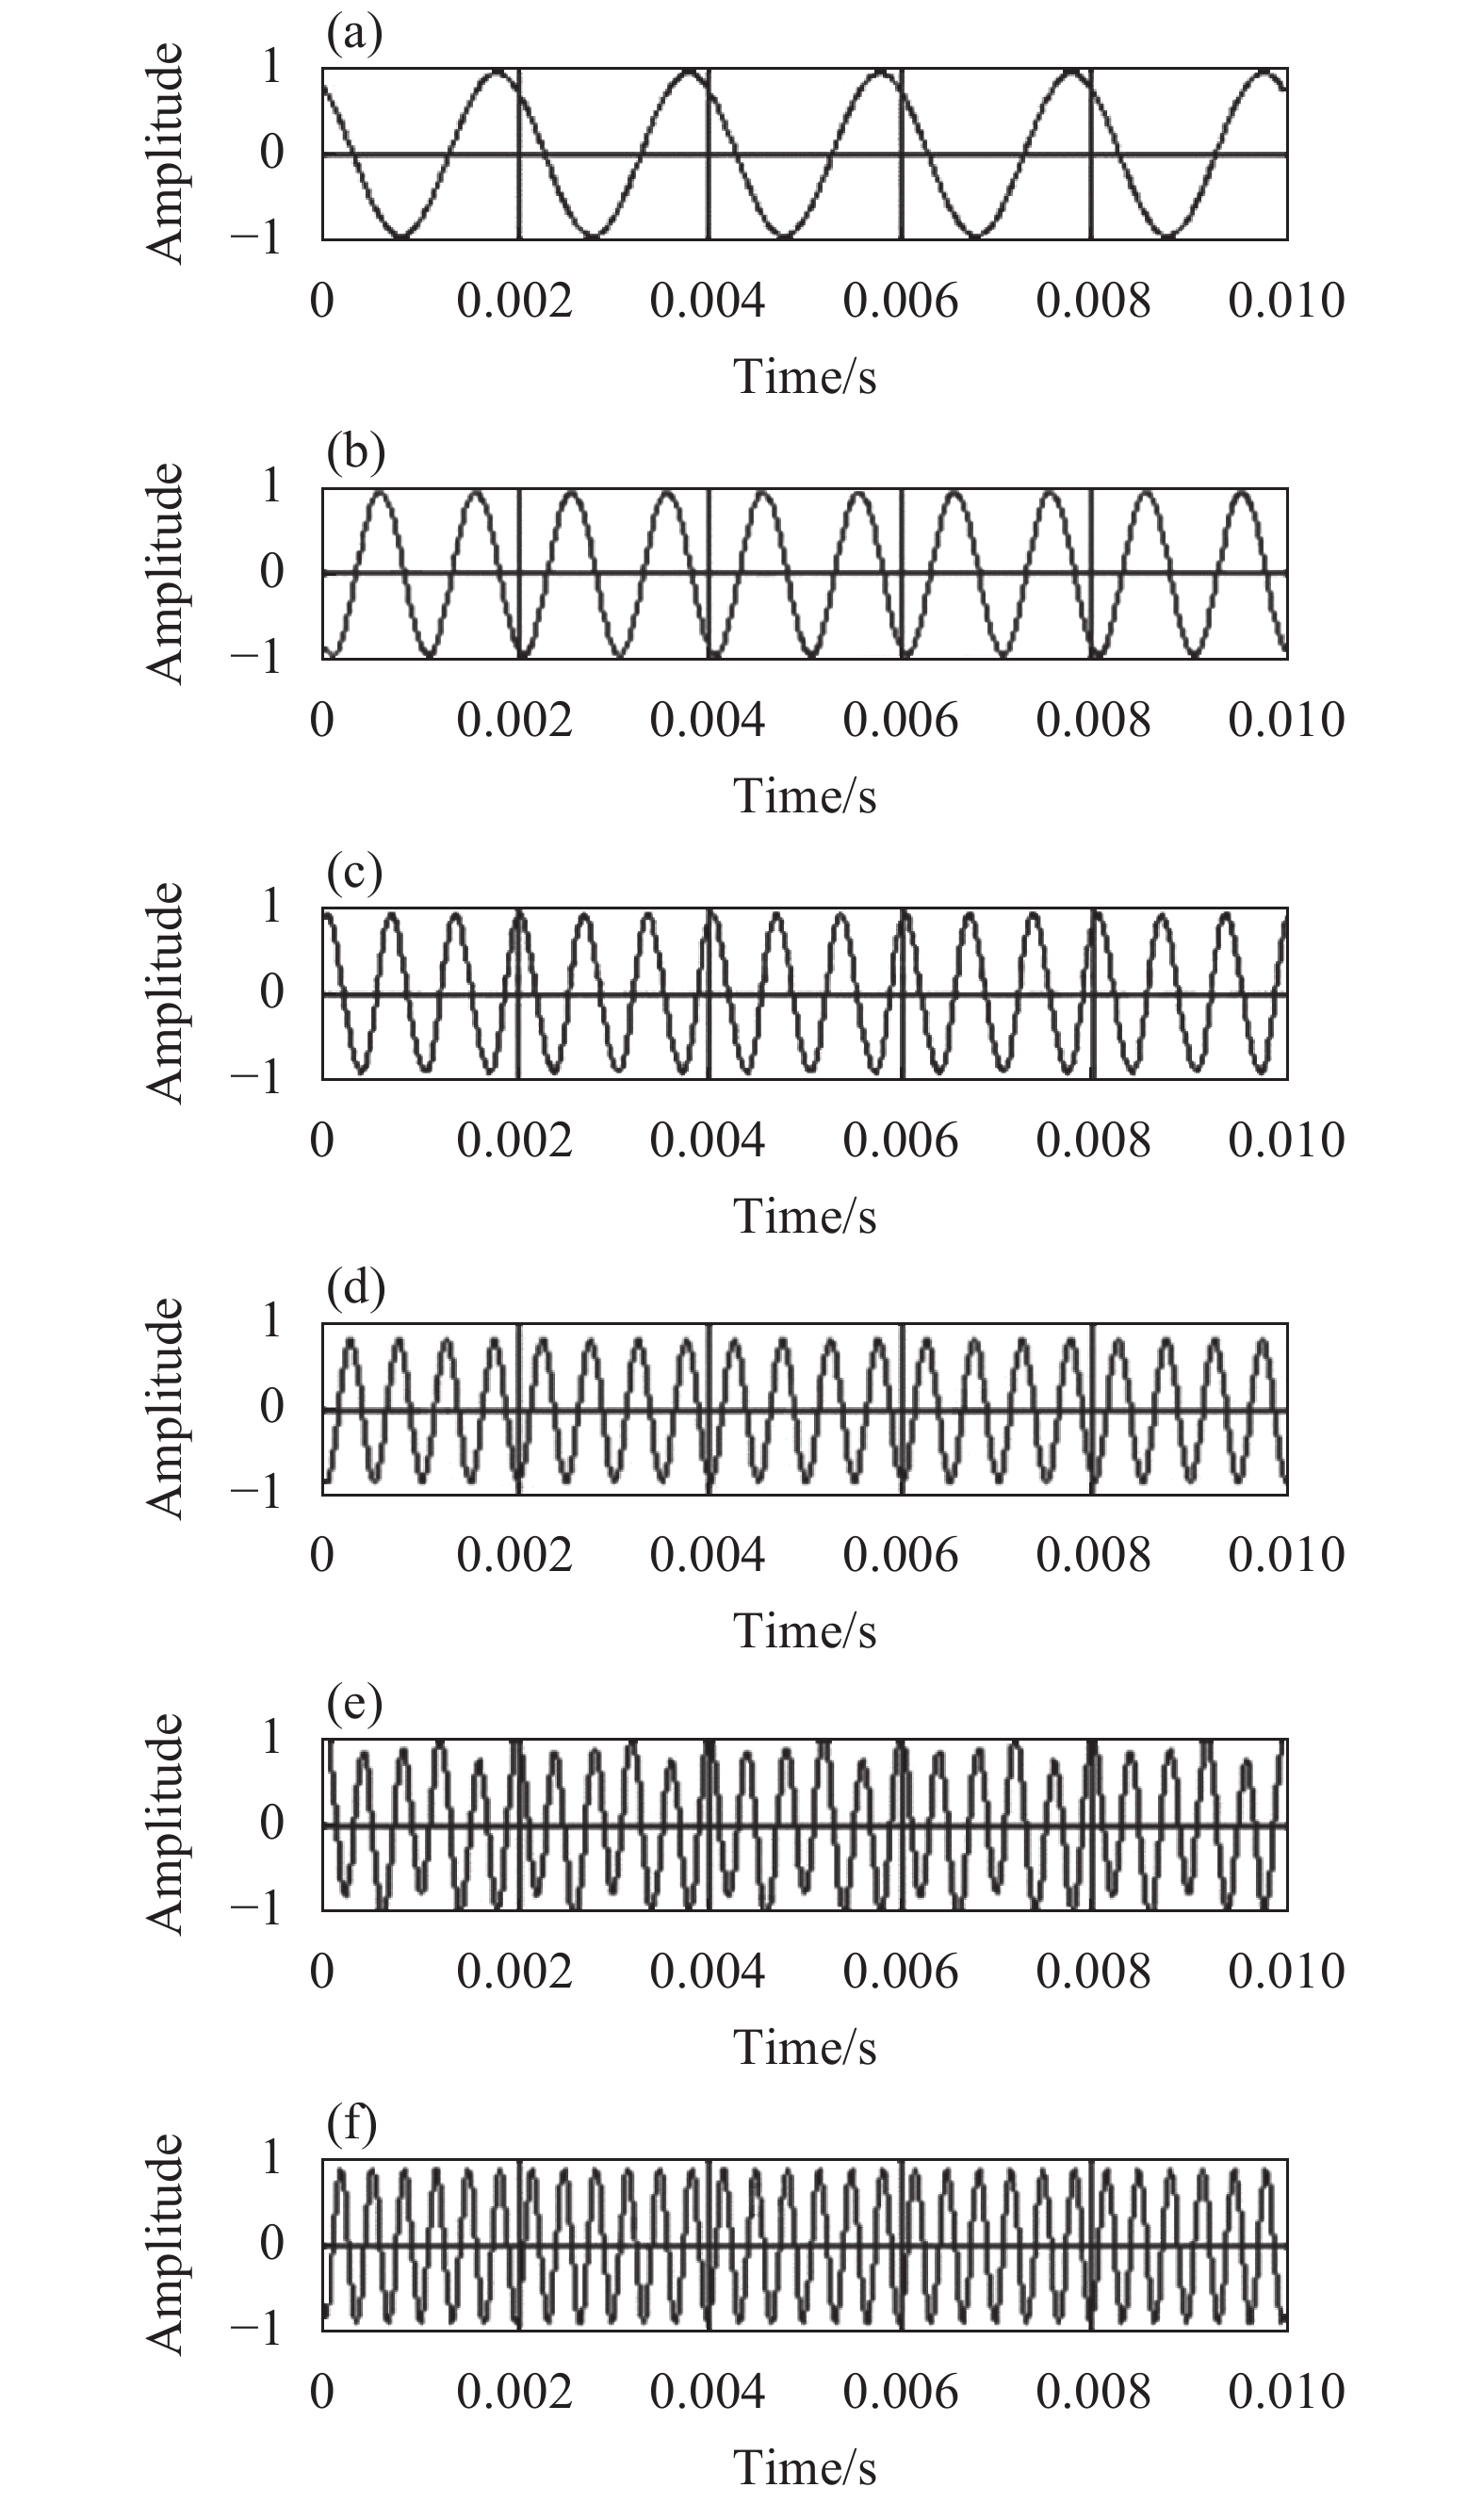
    Fig. 2. Single frequency signal simulation of different frequencies. (a) The frequency is 500 Hz; (b) The frequency is 1 000 Hz; (c) The frequency is 1 500 Hz; (d) The frequency is 2 000 Hz; (e) The frequency is 2 500 Hz; (f) The frequency is 3 000 Hz
    Signal restore of 500 Hz during different interference intensity. (a) B =1 mW; (b)B =2 mW; (c) B = 3 mW; (d) B = 4 mW
    Fig. 3. Signal restore of 500 Hz during different interference intensity. (a) B =1 mW; (b)B =2 mW; (c) B = 3 mW; (d) B = 4 mW
    VI of PGC-DCM and new method
    Fig. 4. VI of PGC-DCM and new method
    Test of the influence of light intensity disturbance on the demodulation result of PGC-DCM and the new method. (a) B=0.5 mW; (b) B =1 mW; (c) B = 2 mW; (d) B = 3 mW
    Fig. 5. Test of the influence of light intensity disturbance on the demodulation result of PGC-DCM and the new method. (a) B=0.5 mW; (b) B =1 mW; (c) B = 2 mW; (d) B = 3 mW
    Experiment architecture
    Fig. 6. Experiment architecture
    Schematic diagram of system experimental setup
    Fig. 7. Schematic diagram of system experimental setup
    Performance of new method tested by different light intensity. (a) Light power is 10 mW; (b) Light power is 20 mW; (c) Light power is 30 mW; (d) Light power is 40 mW
    Fig. 8. Performance of new method tested by different light intensity. (a) Light power is 10 mW; (b) Light power is 20 mW; (c) Light power is 30 mW; (d) Light power is 40 mW
    Test systemValue
    Laser voice acquisition/nmLaser: 1 550
    AWGTEK AFG3102
    Target object/mm3Dimension: 230×120×80
    Laser attenuator/dB0.6-60
    Table 1. Parameters of test system
    Liyan Li, Songtao Fan, Yan Zhou. Eliminating light intensity disturbance algorithm based on phase demodulation carrier[J]. Infrared and Laser Engineering, 2021, 50(9): 20210485
    Download Citation