Author Affiliations
School of Computer and Information, Hefei University of Technology, Hefei, Anhui 230601, Chinashow less
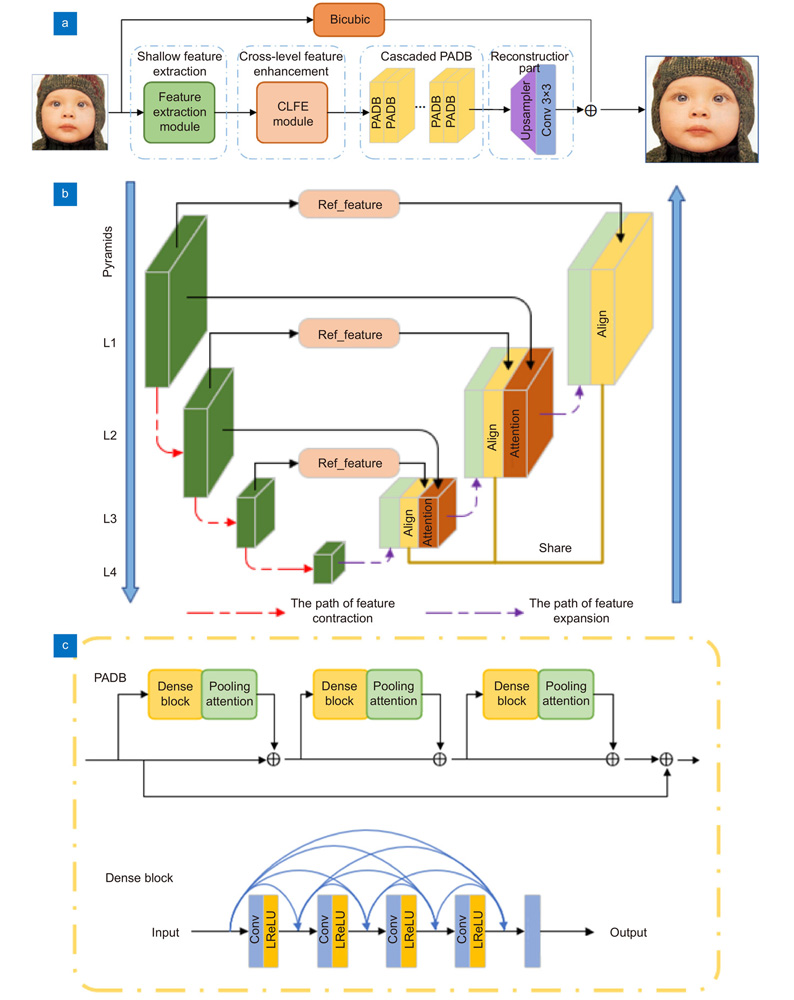
Fig. 1. Basic architectures.
(a) The architecture of our proposed self-similarity enhancement network;
(b) The cross-level feature enhancement module; (c) The pooling attention dense blocks
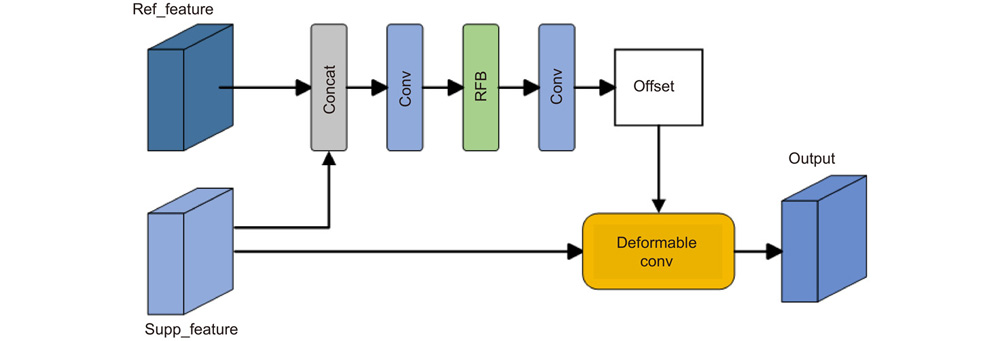
Fig. 2. The proposed feature enhancement module
Fig. 3. Receptive field block
Fig. 4. The proposed Cross-Level Co-Attention architec-ture. "Fgp" denotes the global average pooling
Fig. 5. Schematic illustration of the pooling attention
Fig. 6. Super-resolution results of " Img048" in Urban100 dataset for 4× magnification
Fig. 7. Super-resolution results of " Img092" in Urban100 dataset for 4× magnification
Fig. 8. Super-resolution results of " 223061" in BSD100 dataset for 4× magnification
Fig. 9. Super-resolution results of " 253027" in BSD100 dataset for 4× magnification
Fig. 10. Convergence analysis on CLFE and PADB. The curves for each combination are based on the PSNR on Set5 with scaling factor 4× in 800 epochs.
Fig. 11. Results of each module in the network.
(a) The result of first layer convolution; (b) The results of cross-level feature enhancement module;
(c) The results of Stacked pooling attention dense blocks
| Scale | Method | Set5 | Set14 | BSD100 | Urban100 | Manga109 | | PSNR/SSIM | PSNR/SSIM | PSNR/SSIM | PSNR/SSIM | PSNR/SSIM | | 2× | Bicubic | 33.66/0.9299 | 30.24/0.8688 | 29.56/0.8431 | 26.88/0.8409 | 30.80/0.9339 | | SRCNN[7] | 36.66/0.9542 | 32.45/0.9067 | 31.36/0.8879 | 29.50/0.8946 | 35.60/0.9663 | | VDSR[8] | 37.53/0.9590 | 33.05/0.9130 | 31.90/0.8960 | 30.77/0.9140 | 37.22/0.9750 | | M2SR[23] | 38.01/0.9607 | 33.72/0.9202 | 32.17/0.8997 | 32.20/0.9295 | 38.71/0.9772 | | LapSRN[34] | 37.52/0.9591 | 33.08/0.9130 | 31.80/0.8950 | 30.41/0.9100 | 37.27/0.9740 | | PMRN[35] | 38.13/0.9609 | 33.85/0.9204 | 32.28/0.9010 | 32.59/0.9328 | 38.91/0.9775 | | OISR-RK2[37] | 38.12/0.9609 | 33.80/0.9193 | 32.26/0.9006 | 32.48/0.9317 | − | | DBPN[38] | 38.09/0.9600 | 33.85/0.9190 | 32.27/0.9000 | 32.55/0.9324 | 38.89/0.9775 | | RDN[36] | 38.24/0.9614 | 34.01/0.9212 | 32.34/0.9017 | 32.89/0.9353 | 39.18/0.9780 | | SSEN(ours) | 38.11/0.9609 | 33.92/0.9204 | 32.28/0.9011 | 32.87/0.9351 | 39.06/0.9778 | | 3× | Bicubic | 30.39/0.8682 | 27.55/0.7742 | 27.21/0.7385 | 24.46/0.7349 | 26.96/0.8546 | | SRCNN[7] | 32.75/0.9090 | 29.28/0.8209 | 28.41/0.7863 | 26.24/0.7989 | 30.59/0.9107 | | VDSR[8] | 33.66/0.9213 | 29.77/0.8314 | 28.82/0.7976 | 27.14/0.8279 | 32.01/0.9310 | | M2SR[23] | 34.43/0.9275 | 30.39/0.8440 | 29.11/0.8056 | 28.29/0.8551 | 33.59/0.9447 | | LapSRN[34] | 33.82/0.9227 | 29.79/0.8320 | 28.82/0.7973 | 27.07/0.8272 | 32.19/0.9334 | | PMRN[35] OISR-RK2[37] | 34.57/0.9280
34.55/0.9282
| 30.43/0.8444
30.46/0.8443
| 29.19/0.8075
29.18/0.8075
| 28.51/0.8601
28.50/0.8597
| 33.85/0.9465
−
| | RDN[36] | 34.71/0.9296 | 30.57/0.8468 | 29.26/0.8093 | 28.80/0.8653 | 34.13/0.9484 | | SSEN(ours) | 34.64/0.9289 | 30.53/0.8462 | 29.20/0.8079 | 28.66/0.8635 | 34.01/0.9474 | | 4× | Bicubic | 28.42/0.8104 | 26.00/0.7027 | 25.96/0.6675 | 23.14/0.6577 | 24.89/0.7866 | | SRCNN[7] | 30.48/0.8628 | 27.50/0.7513 | 26.90/0.7101 | 24.52/0.7221 | 27.58/0.8555 | | VDSR[8] | 31.35/0.8838 | 28.02/0.7680 | 27.29/0.7260 | 25.18/0.7540 | 28.83/0.8870 | | M2SR[23] | 32.23/0.8952 | 28.67/0.7837 | 27.60/0.7373 | 26.19/0.7889 | 30.51/0.9093 | | LapSRN[34] | 31.54/0.8850 | 28.19/0.7720 | 27.32/0.7270 | 25.21/0.7551 | 29.09/0.8900 | | PMRN[35] | 32.34/0.8971 | 28.71/0.7850 | 27.66/0.7392 | 26.37/0.7950 | 30.71/0.9107 | | OISR-RK2[37] | 32.32/0.8965 | 28.72/0.7843 | 27.66/0.7390 | 26.37/0.7953 | − | | DBPN[38] | 32.47/0.8980 | 28.82/0.7860 | 27.72/0.7400 | 26.38/0.7946 | 30.91/0.9137 | | RDN[36] | 32.47/0.8990 | 28.81/0.7871 | 27.72/0.7419 | 26.61/0.8028 | 31.00/0.9151 | | SSEN(ours) | 32.42/0.8982 | 28.79/0.7864 | 27.69/0.7400 | 26.49/0.7993 | 30.88/0.9132 |
|
Table 1. The average results of PSNR/SSIM with scale factor 2×,3× and 4× on datasets Set5,Set14,BSD100,Urban100 and Manga109
| Baseline | √ | √ | √ | √ | | CLFE | × | √ | × | √ | | Cascaded PADB | × | × | √ | √ | | PSNR/dB | 32.28 | 32.35 | 32.37 | 32.42 | | SSIM | 0.8962 | 0.8971 | 0.8972 | 0.8982 |
|
Table 2. The results of cross-level and feature enhancement module and pooling attention dense block with scale factor 4× on Set5
| 模型 | 参数 | 计算量 | PSNR/dB | SSIM | | RDN[36] | 22M | 5096G | 34.01 | 0.9212 | | OISR-RK3[37] | 42M | 9657G | 33.94 | 0.9206 | | DBPN[38] | 10M | 2189G | 33.85 | 0.9190 | | EDSR[39] | 41M | 9385G | 33.92 | 0.9195 | | SSEN | 15M | 3436G | 33.92 | 0.9204 |
|
Table 3. Model size and MAC comparison on Set14 (2×), "MAC" denotes the number of multiply-accumulate operations