
Xiangyong Tian, Hong Hu, Bangxin Xu. DEM Construction for Airborne LiDAR Data Based on Combined Filtering Algorithm[J]. Laser & Optoelectronics Progress, 2022, 59(10): 1001001
- Laser & Optoelectronics Progress
- Vol. 59, Issue 10, 1001001 (2022)
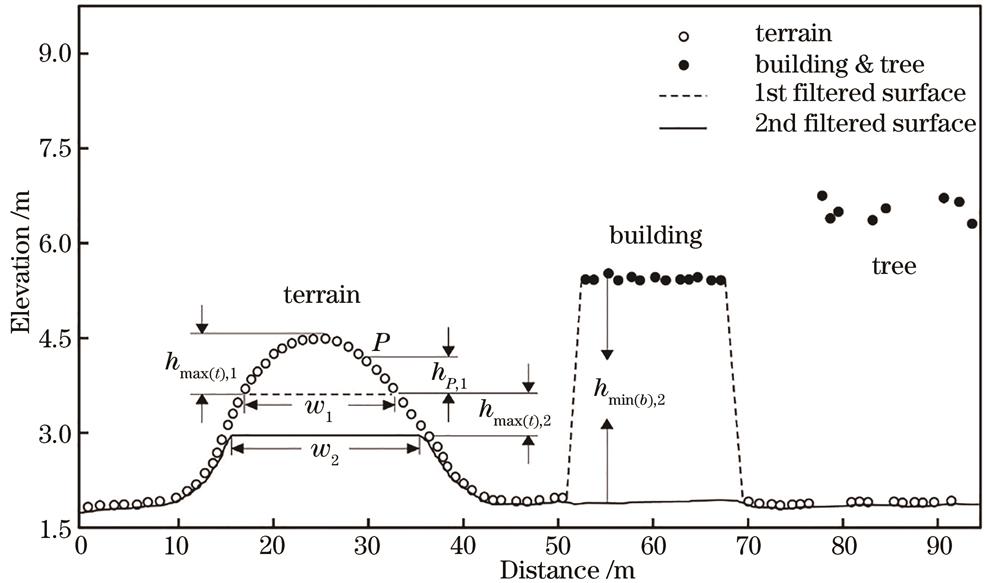
Fig. 1. Schematic of progressive morphological filtering
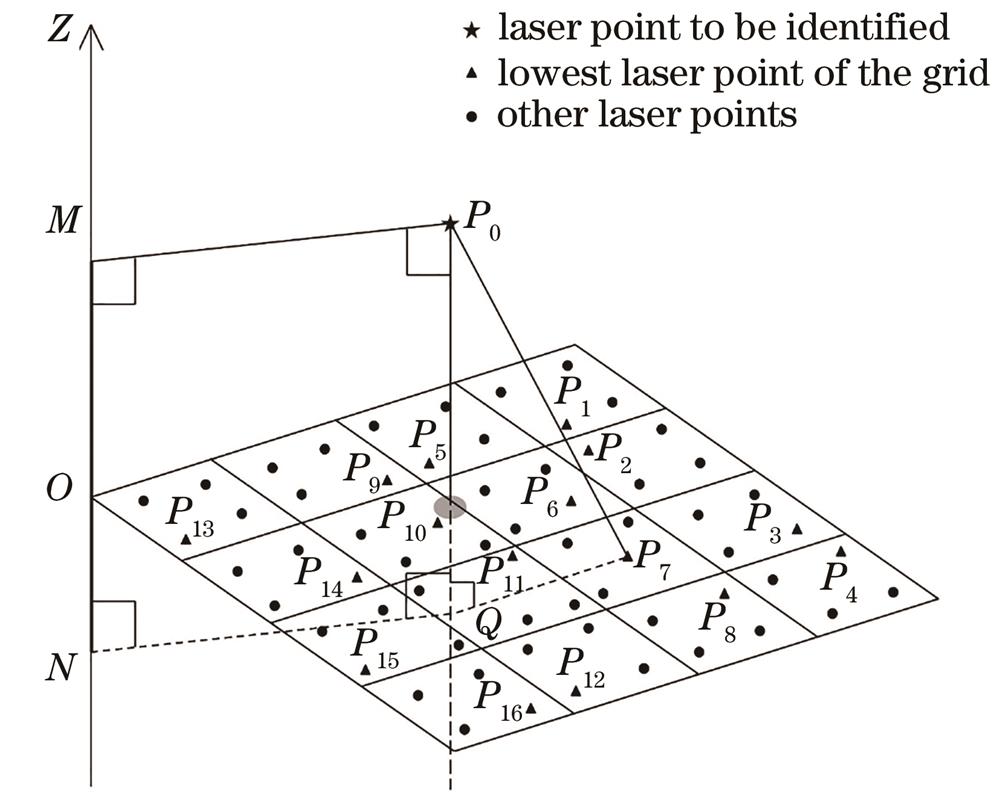
Fig. 2. Schematic of post-processing filtering based on space vector projection
Fig. 3. Original point cloud data. (a) Samp21; (b) Samp31; (c) Samp51; (d) Samp52; (e) Samp53; (f) Samp54
Fig. 4. Ground point cloud extracted by single progressive morphological filtering. (a) Samp21; (b) Samp31; (c) Samp51; (d) Samp52; (e) Samp53; (f) Samp54
Fig. 5. Ground point cloud extracted by progressive morphological filtering and post-processing filtering. (a) Samp21; (b) Samp31; (c) Samp51; (d) Samp52; (e) Samp53; (f) Samp54
Fig. 6. 1 m×1 m resolution DEM and linear regression analysis for Samp21. (a) DSM; (b) reference DEM; (c) DEM without post-processing filtering; (d) DEM with post-processing filtering; (e) linear regression analysis of Fig.6(c) to Fig.6(b); (f) linear regression analysis of Fig.6(d) to Fig.6(b)
Fig. 7. 1 m×1 m resolution DEM and linear regression analysis for Samp31. (a) DSM; (b) reference DEM; (c) DEM without post-processing filtering; (d) DEM with post-processing filtering; (e) linear regression analysis of Fig.7(c) to Fig.7(b); (f) linear regression analysis of Fig.7(d) to Fig.7(b)
Fig. 8. 1 m×1 m resolution DEM and linear regression analysis for Samp51. (a) DSM; (b) reference DEM; (c) DEM without post-processing filtering; (d) DEM with post-processing filtering; (e) linear regression analysis of Fig.8(c) to Fig.8(b); (f) linear regression analysis of Fig.8(d) to Fig.8(b)
Fig. 9. 1 m×1 m resolution DEM and linear regression analysis for Samp54. (a)DSM; (b) reference DEM; (c) DEM without post-processing filtering; (d) DEM with post-processing filtering; (e) linear regression analysis of Fig.9(c) to Fig.9(b); (f) linear regression analysis of Fig.9(d) to Fig.9(b)
Fig. 10. 1 m×1 m resolution DEM and linear regression analysis for Samp52. (a) DSM; (b) reference DEM; (c) DEM without post-processing filtering; (d) DEM with post-processing filtering; (e) linear regression analysis of Fig.10(c) to Fig.10(b); (f) linear regression analysis of Fig.10(d) to Fig.10(b)
Fig. 11. 1 m×1 m resolution DEM and linear regression analysis for Samp53. (a) DSM; (b) reference DEM; (c) DEM without post-processing filtering; (d) DEM with post-processing filtering; (e) linear regression analysis of Fig.11(c) to Fig.11(b); (f) linear regression analysis of Fig.11(d) to Fig.11(b)
| ||||||||||||||||||
Table 1. Cross table
|
Table 2. Parameter of point cloud filtering
| |||||||||||||||||||||||||||||||||||||||||||||||||||||||||||||||||||||||||||||||||||||||||||||||||||||||||||||||
Table 3. Errors, Kappa coefficient, R2, and RMSE of 6 groups of test data

Set citation alerts for the article
Please enter your email address
© Copyright 2018-2021 | Chinese Laser Press. All Rights Reserved 沪ICP备15018463号-20