We presented an interferometric phase shift fiber Bragg grating (FBG) sensor, which inherited the advantages of FBG sensors, and, at the same time, the greatly reduced full-width-at-half-maximum bandwidth brought longer coherent length, higher sensitivity, and lower phase noise. Experiments show that at least a 7 dB reduction of phase noise can be achieved compared to FBG sensors interrogated by interferometer with the same optical path difference.
The interferometric fiber Bragg grating (FBG) sensors have found wide applications in acoustic pressure, acceleration, and vibration sensing fields, providing the benefits of inherent wavelength multiplexing ability, compact structure, and so on[1]. In such applications, an optical path imbalanced fiber interferometer is usually incorporated to convert the signal induced wavelength shift to phase perturbations[2–4]. The background phase noise, thus, is a key parameter, which determines the minimum detectable signal. However, the tolerable optical path difference (OPD) of the interrogation interferometer is very small, since the system coherent length, determined by the full-width-at-half-maximum (FWHM) bandwidth of the FBG, is only 1–2 cm[2], and the system phase noise is also higher compared to other interference systems. Further enlarging the tolerable OPD and reducing the phase noise require narrower FWHM bandwidth, which brings longer FBG or lower reflectivity[1].
In this Letter, we used a phase shift FBG (PS-FBG) to establish the in-line interferometric sensing system. The PS-FBG consists of a narrow bandwidth window within the transmission spectrum, which can be filtered and act as the probe for signal sensing instead of the whole grating reflection peak[5–13]. The dramatically reduced bandwidth brings promising benefits, such as longer coherent length, higher sensitivity, and lower phase noise. Reference [5] is a PS-FBG vibration sensing system, which claims a sensitivity enhancement of 20 dB. Reference [7] is about how to design a shift FBG for ultrasonic detection. Reference [8] presents a PS-FBG acoustic sensor that emphasizes the resolution and sensitivity enhancement. Here, we emphasized the background phase noise. A model describing the system phase noise was established. Both FBG and PS-FBG sensing systems were established, and the phase generated carrier (PGC) method was used to demodulate the phase information. The phase noises of both sensing systems were measured and experiments show that at least a 7 dB reduction of phase noise can be achieved compared to FBG sensors interrogated by interferometer with the same OPD.
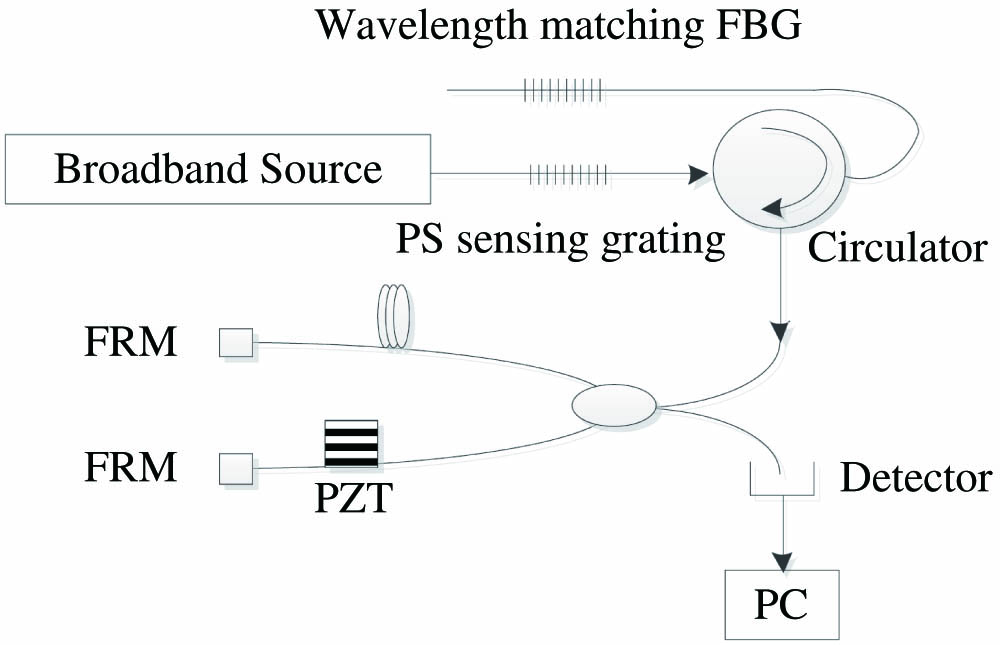
The schematic diagram of PS-FBG sensing system is shown in Fig. 1. There are two gratings in the PS-FBG sensing system, a sensing PS-FBG providing a transmission valley with a narrow window inside and a wavelength matched FBG whose index modulation period is the same as the PS-FBG to filter the transmission window. A broadband light source and a fiber circulator are also incorporated to generate the light input and output. The output of the circulator is then injected to a Michelson fiber interferometer to convert the signal induced wavelength shift to phase perturbations. The interference can be detected by an opto-electro detector and then be sampled into a personal computer (PC) to demodulate the phase signal.
Sign up for Chinese Optics Letters TOC. Get the latest issue of Chinese Optics Letters delivered right to you!Sign up now
Figure 1.Schematic diagram of the PS-FBG sensing system.
The phase noise of the whole sensing system is determined by the laser injected to the interferometer, and therefore, the spectrum of circulator output, denoted as , is an important factor of concern. is the multiplexing result of the PS-FBG transmission and the FBG reflection, denoted as and , respectively, and can be expressed as
The PS-FBG contains one phase discontinuous point in the index modulation profiles, as shown in Fig. 2, where the modulation period and amplitude are denoted as and , respectively. The phase shift was introduced by blocking a small piece of the fiber in the grating center during the UV exposure, and the blocked length is . Thus, the phase shift is . The grating lengths of the left and right parts are denoted as and , respectively.
Here, we used the transfer matrix method to compute the grating spectrum. The PS-FBG was separated into three sections: two sub-FBGs with lengths of and , respectively, and a small section of fiber with a length of . The transfer matrix of the PS-FBG can be written as where the three sub-matrices , , and relate to the transmission matrix of the left sub-FBG, right sub-FBG, and the blocked piece of fiber, respectively, and can be expressed as[1]where is the wavelength mismatch with the Bragg wavelength, is the coupling coefficient, and . Here, is the Bragg wavelength determined by . The transmission spectrum is demonstrated as
The reflection of wavelength matched FBG can also be demonstrated using a matrix as where is the length of FBG, is the coupling coefficient, and . Here, , and is the index modulation amplitude of FBG. The reflection spectrum is demonstrated as
Substituting Eqs. (4) and (6) into Eq. (1), the output spectrum of Fig. 1 can be obtained. Figure 3 is the simulated results of the output spectra with the parameters listed in Table 1.
Figure 3.Output spectra of the PS-FBG sensing system.
The blue dash line indicates the transmission of the PS-FBG, and the gray dot line shows the reflection of the wavelength matched FBG. The filtered narrow spectrum is shown in real line, and it obviously has a much narrower band width than both the PS-FBG and the FBG, which is 0.024 nm with the simulation parameters shown in Table 1.
In the interferometric sensing system, the wavelength of the output peak is modulated by the signals of interest and then is converted to phase perturbations of the interrogation interferometer, which can be demonstrated as
is the OPD of the interferometer, is the undisturbed wavelength, and is the signal induced wavelength shift. The FWHM bandwidth is a key factor determining the system coherent length, which can be expressed as
is the tolerable OPD, and is the FWHM bandwidth. Figure 4 shows the FWHM bandwidth of the output peak versus phase shift [Fig. 4(a)] and index modulation amplitude [Fig. 4(b)]. Figure 4(a) indicates that when the phase shift is near 0 or , the FWHM bandwidth seems smaller. However, this is because the filtered output spectrum is an overlap of the PS-FBG transmission window and the edge of FBG reflection, which will inevitably induce an intensity reduction. Therefore, a shift grating with large index modulation amplitude is more preferable.
Figure 4.FWHM bandwidth versus (a) phase shift and (b) index modulation amplitude.
When used as a sensor, the interesting signal will introduce a deformation to the PS-FBG, as a result, the grating period and fiber index will be changed, and the transmission spectrum will be modulated accordingly. There are two considerations: first the perturbation of will induce a translation of the whole spectrum; second, the deformation of the blocked region will introduce a phase shift variation, and the center wavelength of the output spectrum will be thus modulated. To determine which one plays the main role, the center wavelengths were computed when the PS-FBG underwent different strains. The grating lengths deformation can be expressed as where is the strain. The index perturbation due to the fiber photo-elastic effect is demonstrated by[14]where is the Poisson’s ratio of fiber, and refers to the fiber photo tensor. Generally, the following relationship exists given that , , , and [14]. The simulated results are shown in Fig. 5. The Bragg wavelengths with a strain from 0 to are shown in the black line, varying from 1539.503 nm to 1539.563 nm, indicating a Bragg wavelength shift of 60 pm will be observed with a strain of . The center wavelengths of the PS-FBG transmission window are also shown in Fig. 5 with phase shifts of , , , , and , respectively. The corresponding wavelength shifts are 51.9, 48.5, 46.9, 47.5, and 48.9 pm, respectively, indicating that the PS-FBG with a phase shift far away from exhibits higher sensitivity. Compared to sensors using an FBG directly, the strain induced wavelength shift of PS-FBG sensors seems slightly smaller. However, the sensitivity discrimination is slight, and, if the PS-FBG sensor exhibits attractive enough low noise levels, the cost is also worthwhile.
Figure 5.(a) Wavelength shift with a strain modulation from 0 to . (b) Maximum wavelength shift versus phase shift.
In an interferometric system, the phase noises induced by a light source is generally a combination of white noise and noise[15]. If we denote the OPD induced time delay as , the coherent time limited by the system line width as , and, when , the phase noise induced by light source can be expressed as[16]
here refers to the phase noise power spectral density. is a coefficient relating to the light intensity, and, in our simulation, we set to obtain a normalized phase noise level. Please note here that the difference of between in the simulation and that in the experimental system will only introduce a translation toward a higher or lower level. is the time delay of light returned from different paths of the interferometer and is determined by the OPD, described using the following relationship:
is the OPD, and is the light velocity in vacuum. is the coherent time determined by the FWHM bandwidth of grating and can be expressed as
is the FWHM bandwidth, and is the center wavelength of the grating. is the coherent time of noise. The phase noise can then be written as
The first item on the right is the phase noise induced by the light source line width and interferometer OPD. Since is very small and approximately equals 1 when the concerned noise frequency is lower than megahertz (MHz), therefore, this item is generally treated as white noise independent of frequency. The second item is the phase noise original from the noise of the light source. When the concerned noise frequency is far lower than 1 MHz, is small, and , this item can be simplified as . Here, is the coherent time of noise, which is determined by the Doppler broadening of the active material in the light source[17]. For the -doped amplified spontaneous emission (ASE) source, is about [18].
Figure 6 shows the simulated results of phase noise when the FWHM bandwidths were 0.015 and 0.1 nm, respectively. The OPD in simulation is 10 mm. It is clear that the narrower the , the lower the phase noise level. However, this advantage is not obvious in the low frequency band, where the noise plays a main role that is independent of . When is smaller, the light source line width and OPD induced white noise is low, and the noise thus dominates the total phase noise level [Fig. 6(a)]. When increases to 0.1 nm, the noise is noticeable only in the lower frequency range, and the white noise gradually dominates the total phase noise level as the frequency increases [Fig. 6(b)].
Figure 6.Simulated phase noise with an OPD of 10 mm and of (a) 0.015 nm and (b) 0.1 nm.
Figure 7 is the simulated results of phase noise at 1 kHz versus OPD when equals 0.015 nm. It is obvious that the larger the OPD, the higher the phase noise at 1 kHz. When the OPD is small, the curve indicating total phase noise coincides with that indicating the noise. As the OPD increases, the total phase noise level becomes slightly higher than the noise due to the rising up of white noise. However, the two curves are very close to each other, indicating that the total phase noise is still determined by the noise. In the PS-FBG sensing system, is usually at the magnitude of 0.015 nm, and the coherent length is about 156 mm, given a center wavelength of 1539 nm. Therefore, the noise is the main source of system phase noise.
Figure 7.Simulated results of phase noise at 1 kHz versus OPD when equals 0.015 nm.
The experimental setup of the PS-FBG sensing system is shown in Fig. 1. In our experiment, an -doped fiber ASE source was used. The PS-FBG and FBG were glued side by side to experience same strain or temperature induced wavelength shift to eliminate the wavelength mismatching problem. We used the PGC method to demodulate the system phase information, and, thus, a piezoelectric transducer (PZT) and two Faraday rotating mirrors (FRMs) were incorporated in the interrogation interferometer to introduce the carrier signal for PGC demodulation and to eliminate the polarization induced signal fading, respectively. The PS-FBG was fabricated using a 248 nm excimer laser and the phase mask method. A 15 mm rectangle light window with a blocked region of 1 mm was established before the phase mask. The transmission spectrum of the PS-FBG is shown in Fig. 8(a) with a phase shift of . The center wavelength of the transmission window is 1539.8 nm, and the FWHM bandwidth is 0.02 nm. Another PS-FBG, instead of FBG, was used as the reflector to provide a much narrower reflection bandwidth than FBG, and the transmission spectrum is also shown in Fig. 8(a). The phase shift is , and, thus, a main reflection peak can be observed on the left of the Bragg wavelength with an FWHM bandwidth of 0.06 nm. The two PS-FBGs were then glued to a piezoelectric ring side by side with different pretensions to compel the spectrum of the two PS-FBGs to overlap with each other, and the output spectrum is shown in Fig. 8(b). The output spectrum shows an FWHM bandwidth of 0.015 nm and a signal-to-noise ratio (SNR) of 10 dB, indicating a maximum OPD of 156.6 mm.
Figure 8.Measured spectra of the (a) transmission of the PS-FBGs and (b) output.
Figure 9(a) shows an experimental system to exactly measure the OPD of interrogation interferometer. A broadband light wave was directly injected into the interferometer, and the interferometer fringes were recorded using an optical spectrum analyzer (OSA). The OPD is derived from the wavelength distance of two adjacent peaks or valleys, which is shown in Fig. 9(b) as an example. The wavelength distance of two adjacent peaks or valleys, denoted as and , respectively, is determined by the interferometer OPD , and the OPD can thus be expressed as .
Figure 9.(a) The experimental setup for OPD measurements and (b) measured results.
We first fabricated an interrogation interferometer with a designed OPD of 8 mm, and the measurement results are shown in Fig. 9(b). The wavelength distance of two adjacent peaks is 0.28 nm, and the OPD is 8.5 mm, indicating that the fiber length difference of the two paths is 2.93 mm given a fiber index of 1.45. Then, the interferometer was used to interrogate the PS-FBG sensing system. The interference and phase noise are shown in Fig. 10(a), where the upper figure is the interference in the time domain, and the lower figure is that in the frequency domain. The PGC modulation frequency is 12.5 kHz with an amplitude of 2.37 V. The visibility of the interference is about 0.3. Figure 10(b) is the demodulated phase noise level. The total curve exhibits the properties of noise characterized by that of when the lower the frequency, the higher the noise level. However, when the frequency is larger than 1 kHz, the phase noise level decreasing with frequency is slight. This is because the pigtail of the curve is raised up by other system white noises, such as electronic noise and light scattering noise. The measured phase noise is about at 1 kHz.
Figure 10.(a) Measured interference in the time (upper) and frequency (lower) domains and (b) demodulated phase noise level.
Then, the OPD of the interrogation interferometer was enlarged to be 31.6, 47.4, 87, and 100 mm, respectively, and the measured visibilities are 0.19, 0.18, 0.1, and 0.08, respectively. For each OPD, including the abovementioned one of 8.5 mm, the phase noises were measured 100 times, and the cumulated phase noise is shown in Fig. 11(a). It is obvious that the longer the OPD, the higher the phase noise level.
Figure 11.(a) Phase noise level with different OPDs, and (b) phase noise at 1 kHz.
The phase noises at 1 kHz are , , , , and , respectively, as shown in Fig. 11(b). Theoretically, the coefficient C can be obtained using any one of the above measured results, and we used the result with an OPD of 47.4 mm to obtain a C of 17.5 dB. The revised theoretical curve of phase noise at 1 kHz versus OPD is also plotted in Fig. 11(b), which fits well with the measured results.
In order to evaluate the phase noise promotion of the PS-FBG sensing system, an interferometric FBG sensing system was established. The schematic diagram is similar with that shown in Fig. 1, but the PS-FBG was not included, and the reflection of the sensing FBG was directly injected into the interrogation interferometer. The center wavelength is 1550.314 nm, and the FWHM bandwidth is 0.1 nm, indicating a maximum OPD of 24 mm. Two interrogation interferometers were fabricated with OPDs of 6.8 and 10.9 mm, respectively. The measured phase noises are shown in Fig. 12. The phase noises at 1 kHz are and , respectively, indicating that the longer the OPD, the higher the phase noise, in accordance with that of the PS-FBG. The phase noise of the PS-FBG sensing system is with an OPD of 8.5 mm. Therefore, a promotion of at least 7 dB can be obtained with the same OPD of 6.8 mm. Similarly, the phase noise of the PS-FBG sensing system is with an OPD of 31 mm, and therefore, a promotion of at least 13 dB can be obtained with the same OPD of 10.9 mm.
Figure 12.Measured phase noise level with an interrogation interferometer OPD of (a) 6.8 mm and (b) 10.9 mm.
In conclusion, the interferometric PS-FBG sensors can be used to detect lots of dynamic signals, which inherit the advantages of FBG sensors. It can provide higher tolerable OPDs and lower phase noise than the FBG. The phase noise model indicates that the phase noise of the PS-FBG sensing system mainly originates from the noise of the light source. Both PS-FBG and FBG sensing systems were established and measured results show that at least a 7 dB promotion of phase noise can be achieved compared to FBG sensors interrogated by an interferometer with the same OPD.