• Spectroscopy and Spectral Analysis
  • Vol. 41, Issue 1, 164 (2021)
Li-juan OU*, Xue-zhong AN, Jian-xin LUO, Ling-yun WANG, Heng BO, Ai-ming SUN, and Lan-lan CHEN
Author Affiliations
  • College of Material and Chemical Engineering, Hunan Institute of Technology, Hengyang 421002, China
  • show less
    DOI: 10.3964/j.issn.1000-0593(2021)01-0164-04 Cite this Article
    Li-juan OU, Xue-zhong AN, Jian-xin LUO, Ling-yun WANG, Heng BO, Ai-ming SUN, Lan-lan CHEN. High-Sensitive and Rapid Fluorescencet Detection of Hg2+ Based on Poly(adenine)-Templated Gold Nanoclusters[J]. Spectroscopy and Spectral Analysis, 2021, 41(1): 164 Copy Citation Text show less
    Schematic representation of a Hg2+ sensor based on A15-ssDNA AuNCs
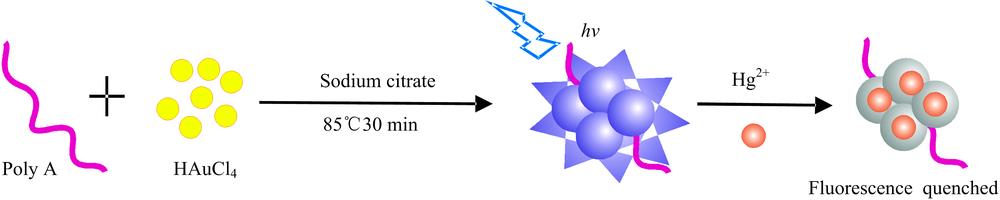
    Fig. 1. Schematic representation of a Hg2+ sensor based on A15-ssDNA AuNCs
    (a) TEM images of DNA-AuNCs; (b) The Fluorescence excitation and emission spectra of AuNCs;(c) Fluorescence emission spectra of AuNCs under different conditionsa: AuNCs; b: AuNCs+Hg2+
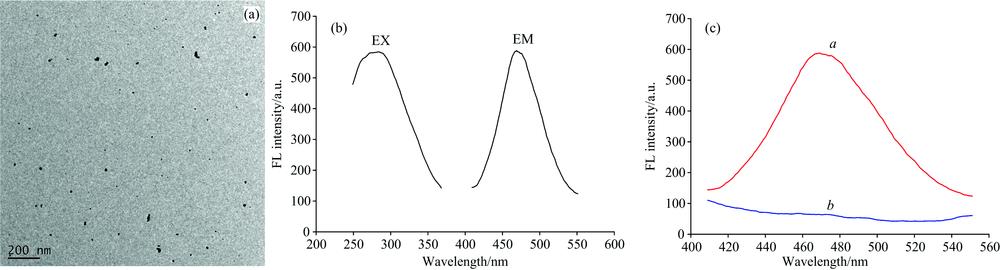
    Fig. 2. (a) TEM images of DNA-AuNCs; (b) The Fluorescence excitation and emission spectra of AuNCs;(c) Fluorescence emission spectra of AuNCs under different conditions
    a: AuNCs; b: AuNCs+Hg2+
    (a) Effects of the pH in the absence (a) and presence of Hg2+ (b); (b) Effects of the reaction time
    Fig. 3. (a) Effects of the pH in the absence (a) and presence of Hg2+ (b); (b) Effects of the reaction time
    (a) Fluorescence spectra with different concentration of Hg2+ (the concentration from up to down were 0, 0.01, 0.05, 0.1, 0.2, 0.4, 0.6, 0.8, 1, 2, 5, 10, 20, 50 μmol·L-1); (b) Plot of fluorescence intensity of the AuNCs versus Hg2+ concentration. Inset: relative fluorescence intensity versus Hg2+ concentration; (c) Selectivity analysis of the sensor for Hg2+. The concentration of Hg2+ and other interferences are 20 and 50 μmol·L-1, respectively
    Fig. 4. (a) Fluorescence spectra with different concentration of Hg2+ (the concentration from up to down were 0, 0.01, 0.05, 0.1, 0.2, 0.4, 0.6, 0.8, 1, 2, 5, 10, 20, 50 μmol·L-1); (b) Plot of fluorescence intensity of the AuNCs versus Hg2+ concentration. Inset: relative fluorescence intensity versus Hg2+ concentration; (c) Selectivity analysis of the sensor for Hg2+. The concentration of Hg2+ and other interferences are 20 and 50 μmol·L-1, respectively
    自来水
    样品
    加入值
    /(μmol·L-1)
    检测值
    /(μmol·L-1)
    回收率
    /%
    RSD
    /%
    10.30.307102.33.6
    20.60.57295.333.1
    30.90.934103.83.4
    Table 1. Recovery of the biosensor for determination of Hg2+ in tap water samples
    Li-juan OU, Xue-zhong AN, Jian-xin LUO, Ling-yun WANG, Heng BO, Ai-ming SUN, Lan-lan CHEN. High-Sensitive and Rapid Fluorescencet Detection of Hg2+ Based on Poly(adenine)-Templated Gold Nanoclusters[J]. Spectroscopy and Spectral Analysis, 2021, 41(1): 164
    Download Citation