
Li WANG, Shi-fang GAO, Lu-ping MENG, Liang SHANG, Meng SHI, Guang-qiang LIU. Au-Nanorod Patterned Optical Fiber SERS Probes Fabricated by Laser-Induction[J]. Spectroscopy and Spectral Analysis, 2022, 42(11): 3454
- Spectroscopy and Spectral Analysis
- Vol. 42, Issue 11, 3454 (2022)
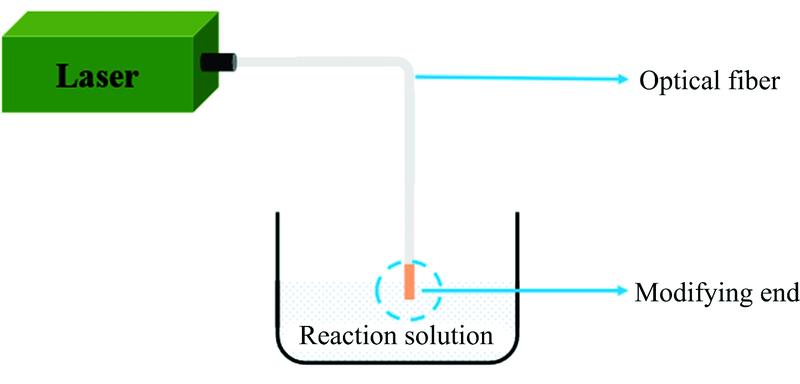
Fig. 1. Apparatus for inducing the deposition process
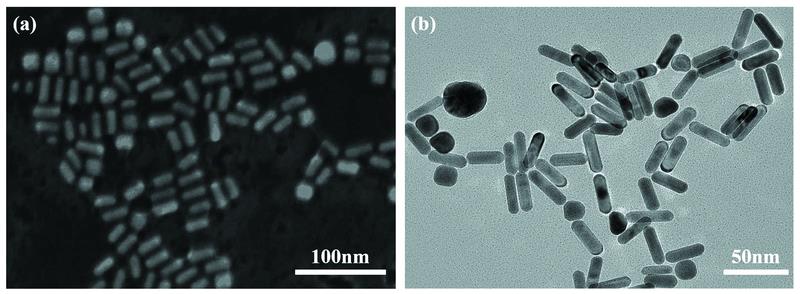
Fig. 2. Morphologies of gold nanorods
(a): SEM image; (b): TEM image of
(a): SEM image; (b): TEM image of
Fig. 3. Length and diameter of gold nanorods
Fig. 4. SERS experimental device of fiber optic probe
Fig. 5. Schematic diagram of laser induction process
Fig. 6. SEM image of the end surfaces of laser induced fiber probes
(a), (b) and (c): The end surfaces of laser fiber fabricated by laser induction in gold nanorod solutions with concentrations of 1.5×10⁻⁹, 1.0×10⁻⁹, 7.5×10⁻¹⁰ mol·L-1 respectively; (d), (e) and (f): The details of (a), (b) and (c) respectively; (g): The enlarged SEM image of (e); (h): The enlarged SEM image of (f)
(a), (b) and (c): The end surfaces of laser fiber fabricated by laser induction in gold nanorod solutions with concentrations of 1.5×10⁻⁹, 1.0×10⁻⁹, 7.5×10⁻¹⁰ mol·L-1 respectively; (d), (e) and (f): The details of (a), (b) and (c) respectively; (g): The enlarged SEM image of (e); (h): The enlarged SEM image of (f)
Fig. 7. (a) SERS spectra measured using the optical fiber probes fabricated by laser induced deposition in the gold nanovods solutions with the concentrations of 1.5×10⁻⁹, 1.0×10⁻⁹ and 7.5×10⁻¹⁰ mol·L-1; (b) SERS spectra after baseline removal
The concentration of 4-ATP is 1×10⁻⁶ mol·L-1
The concentration of 4-ATP is 1×10⁻⁶ mol·L-1
Fig. 8. SERS intensity of peak at 1 079.971 cm-1 using the probes fabricated in the gold nanorods solutions with concentrations of 1.5×10⁻⁹, 1.0×10⁻⁹ and 7.5×10⁻¹⁰ mol·L-1
Colours correspending to various concentration are the same as inFig.7
Colours correspending to various concentration are the same as in
Fig. 9. (a) The electric field intensity distribution of a single gold nanorod; (b) and (c) The electric field intensity distributions of two gold nanorods arranged at any Angle; (d), (e) and (f) The electric field intensity distributions of two gold nanorods side by side
Fig. 10. (a)Raman spectrum of 4-ATP measured again by optical fiber SERS probe prepared in gold nanorod solution with concentration of 7.5×10⁻¹⁰ mol·L-1 after 15 days; (b) Raman spectrum of 4-ATP measured by SERS probe prepared in 7.5×10⁻¹⁰ mol·L-1 gold nanorod solution

Set citation alerts for the article
Please enter your email address
© Copyright 2018-2021 | Chinese Laser Press. All Rights Reserved 沪ICP备15018463号-20